
Financial analytics uses techniques from data analysis, data science, and statistical methods to analyze financial and non-financial data to support commercial decision-making. Financial analytics involves collecting, analyzing, and interpreting financial data and non-financial data to gain an accurate and deep understanding of your company’s financial performance, trends, and patterns.
Financial data can include asset values, liability values, equity, expenses, income, and cash flow, among many others.
Together, this data provides an overall idea of how well your company is operating. It helps you understand the business's financial status, forecast future financial scenarios, manage risks effectively, and make informed decisions.
Financial analytics combines data science techniques, business intelligence, and domain knowledge of finance principles.
For example, you can use a vast amount of financial data to perform financial modeling, budgeting, forecasting, and performance analysis. The ultimate goal of financial analytics is to improve the quality of financial decision-making by providing a comprehensive view of financial health and performance.
What does a Financial Analyst do?
A financial analyst analyzes financial data to help businesses or individuals make decisions. They examine financial statements, market trends, and economic conditions to assess the company’s performance, estimate future earnings or cash flow, provide investment recommendations, and manage financial risks.
Financial analysts work in various segments and across almost all industries. Most businesses employ some sort of financial analyst, but other types of companies such as investment banks, mutual funds, hedge funds, insurance companies, and other financial institutions may employ a great deal more of them.
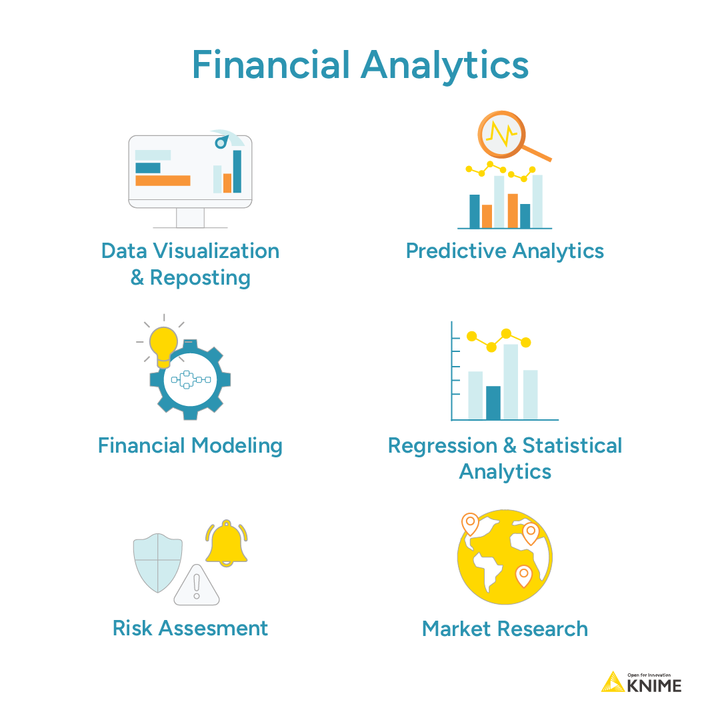
A financial analyst’s primary role is to analyze financial data and trends to support the decision-making processes. The specific responsibilities of a financial analyst can vary depending on their role and where they work but generally include:
- Analyze financial statements: Reviewing the balance sheet, income statement, and cash flow statement to assess a company's financial health.
- Forecast and do predictive analysis: Developing financial models to predict future trends, revenue, expenses, and cash flows, based on historical data and market conditions.
- Build visualizations and dashboards: Creating visual representations of financial data, such as graphs and charts, to make complex data more accessible and actionable.
- Regression and statistical analysis: Applying regression models (linear, logistic, etc.) to uncover relationships between variables, assess risk factors, or optimize financial strategies.
- Investment analysis: Evaluating investment opportunities by analyzing market trends, economic conditions, and financial performance of potential investments.
- Risk assessment: Identifying financial risks by data-driven models like regression analysis and machine learning to predict and quantify risks, and recommending strategies to mitigate them.
- Market research: Researching industry trends, market conditions, and competitor performance using financial data such as revenue, profit margins, and economic indicators to make informed strategic planning and decisions.
How to Become a Financial Analyst
To become a financial analyst, you typically need a combination of education, skills, certifications, and experience. According to Glassdoor, the average salary for financial analysts in the USA is $127,405, making it a lucrative career path.
Here’s a general pathway you could take to become a financial analyst, although people arrive at financial analysis from a range of backgrounds:
- Education: A bachelor’s degree in finance, accounting, economics, or a related field is often required. Courses in statistics, mathematics, economics, and financial analysis are particularly useful for training up the skills you’ll use every day as a financial analyst.
- Certifications: Get certified as a data scientist or a data analyst. Certifications such as Chartered Financial Analyst (CFA), Certified Public Accountant (CPA), or Financial Risk Manager (FRM) are highly regarded in the industry.
- Skills: Analytical thinking, proficiency in financial software and tools, understanding of financial modeling and valuation techniques, and strong communication skills are all needed to be an effective financial analyst. Strong data visualization skills are also critical for communicating outcomes and making recommendations to stakeholders.
- Experience: Internships or entry-level positions in finance can provide valuable experience. Many financial analysts start in roles such as financial assistants or associates before advancing to analyst positions. Although many financial analysts take a route through audit, accountancy, or tax, training in a commercial finance department can pay dividends down the line for sharpening your business sense.
- Networking: Building a professional network through internships, university programs, and industry events can provide valuable connections and opportunities. For example, KNIME hosts events such as online webinars, DataHops, which are in-person, roadshow events, and the yearly KNIME Summit which is a 3-day data science event. You can attend them to hear best practices for working with data, learn about low-code data science with KNIME, and expand your network by connecting with industry peers and experts in a local, intimate setting.
Why is Financial Analytics Important?
In a data-driven business environment, the ability to analyze and interpret financial data is more crucial than ever. Financial analytics affects all parts of a business and is key in helping companies predict and plan for the future. By using advanced analytical techniques, businesses can better understand their financial health, anticipate challenges, and uncover growth opportunities. In the following sections, we will explore nine important reasons why financial analytics is indispensable for organizations.
1. Informed Decision-Making
Financial analysts and financial analytics make it possible to get accurate and actionable insights from data so you can make better decisions about how to expand or improve your business. Here are two examples of ways financial analysts contribute to this:
- Scenario Planning: Financial analytics perform scenario planning, where different strategies are tested under various market conditions. This can help you understand potential outcomes and prepare for unexpected events.
- Data-Driven Strategies: Financial analytics can lead to more effective strategies for pricing, budgeting, investment, and resource allocation. This reduces guesswork and enhances the likelihood of achieving desired financial outcomes.
2. Performance Measurement and Benchmarking
Financial analytics is essential for measuring and benchmarking a company’s performance against industry standards or competitors. This process helps identify areas where the company excels or needs improvement. Here are two ways financial analysts help support this:
- Key Performance Indicators (KPIs): Financial analysts will collect, set, and use KPIs to monitor specific aspects of performance such as revenue growth, profit margins, return on investment (ROI), and operating costs. These metrics help provide company leaders with a clear picture of how well the company is performing in relation to its goals.
- Performance Benchmarks: By comparing performance data with industry benchmarks, financial analysts help determine competitiveness. This can highlight operational inefficiencies, lack of pricing competitiveness, or reveal other opportunities to capitalize on market trends.
3. Risk Management
One of the critical roles of financial analytics is identifying, assessing, and managing financial risks. This includes credit risk, market risk, liquidity risk, and operational risk.
- Credit Risk Analysis: Financial analytics can assess the creditworthiness of customers or counterparties by analyzing their financial statements, payment histories, and market conditions. This helps in making lending decisions and setting credit limits.
- Market Risk Management: By analyzing market trends and volatility, an analyst can better understand potential risks associated with changes in interest rates, foreign exchange rates, and commodity prices. This allows you to hedge against adverse movements and protect your financial positions.
- Predictive Analytics for Risk: Advanced predictive models can forecast potential risks and their impact on financial performance. For example, predictive analytics can be used to anticipate defaults in loan portfolios or identify patterns that indicate fraudulent activity.
4. Strategic Planning and Forecasting
Financial analytics provides a foundation for strategic planning and forecasting by offering insights into past performance and future trends. This can help your company set realistic goals, allocate resources efficiently, and plan for long-term growth.
- Budgeting and Forecasting: Financial analytics can help you create and monitor budgets and forecasts that guide operational and financial planning. These forecasts consider various factors such as market conditions, economic indicators, and historical performance, ensuring more accurate and reliable financial planning.
- Long-Term Strategy Development: With the help of financial analytics, you can develop long-term strategies that align with your financial goals. This involves assessing potential investments, mergers, and acquisitions, or exploring new markets based on financial feasibility and projected returns.
5. Enhancing Operational Efficiency
Financial analytics can uncover inefficiencies in business processes and identify cost-saving opportunities. By analyzing financial data, you can streamline operations, reduce waste, and improve productivity.
- Cost Management: Through detailed analysis of cost structures, financial analytics helps you to identify areas where costs can be reduced without affecting quality or performance. This might include negotiating better terms with suppliers, optimizing inventory levels, or reducing overhead expenses.
- Process Optimization: Financial analytics can reveal inefficiencies in workflows or supply chains that, when addressed, can lead to significant savings and improved profitability. For example, analyzing production costs and timelines can help identify bottlenecks and improve manufacturing efficiency.
- Revenue Generation and Margins: Financial analysts have a role in setting and modeling pricing options, which can help move companies towards goals or earn more margin on sales.
6. Facilitating Capital Allocation
Effective capital allocation is crucial for maximizing shareholder value. Financial analytics assists in determining how capital should be allocated across different projects or business units to achieve the highest returns.
- Investment Analysis: By evaluating potential investment opportunities using techniques like discounted cash flow (DCF) analysis, internal rate of return (IRR), and net present value (NPV), financial analysts can help you select the projects that offer the best potential for growth and profitability.
- Capital Budgeting: Financial analytics support you in the capital budgeting process by providing a clear picture of the expected costs and benefits of various investment options. This ensures that capital is allocated to projects that are aligned with the company’s strategic objectives and have the potential to generate significant returns.
7. Supporting Mergers and Acquisitions (M&A)
In M&A transactions, financial analytics is vital for evaluating the financial health and value of potential target companies. This involves due diligence processes to assess financial statements, understand revenue drivers, and identify any hidden liabilities.
- Valuation Analysis: Financial analytics is used to determine the fair value of a company or its assets. This includes analyzing financial statements, cash flows, and market conditions to arrive at an accurate valuation, which is crucial for negotiating the terms of an acquisition or merger.
- Post-Merger Integration: After a merger or acquisition, financial analytics helps in integrating the financial systems of the merged entities, aligning financial reporting, and ensuring that the combined company meets its financial goals.
8. Improving Investor Relations
Financial analytics also plays a key role in maintaining healthy investor relations by providing transparent and accurate financial information.
- Financial Reporting: Regular financial reporting backed by robust analytics helps in building trust with investors by providing a clear and accurate picture of the company’s financial health and performance.
- Earnings Guidance: You can use financial analytics to provide earnings guidance to investors, helping them set realistic expectations and avoid surprises. This improves investor confidence and can positively impact stock prices.
9. Enhancing Regulatory Compliance
Financial analytics helps companies comply with various financial regulations and standards by ensuring accurate and timely reporting.
- Compliance Monitoring: Financial analytics can be used to monitor compliance with regulatory requirements such as the Sarbanes-Oxley Act (SOX) in the U.S., International Financial Reporting Standards (IFRS), or local tax laws.
- Audit Readiness: By maintaining accurate and detailed financial records, financial analytics ensures that you are always prepared for audits, reducing the risk of non-compliance penalties.
Financial Analytics Use Cases
Financial analytics can be applied in many ways across different industries. That makes it difficult to pin down globally relevant use cases. However, you can use KNIME to automate tasks in any finance department.
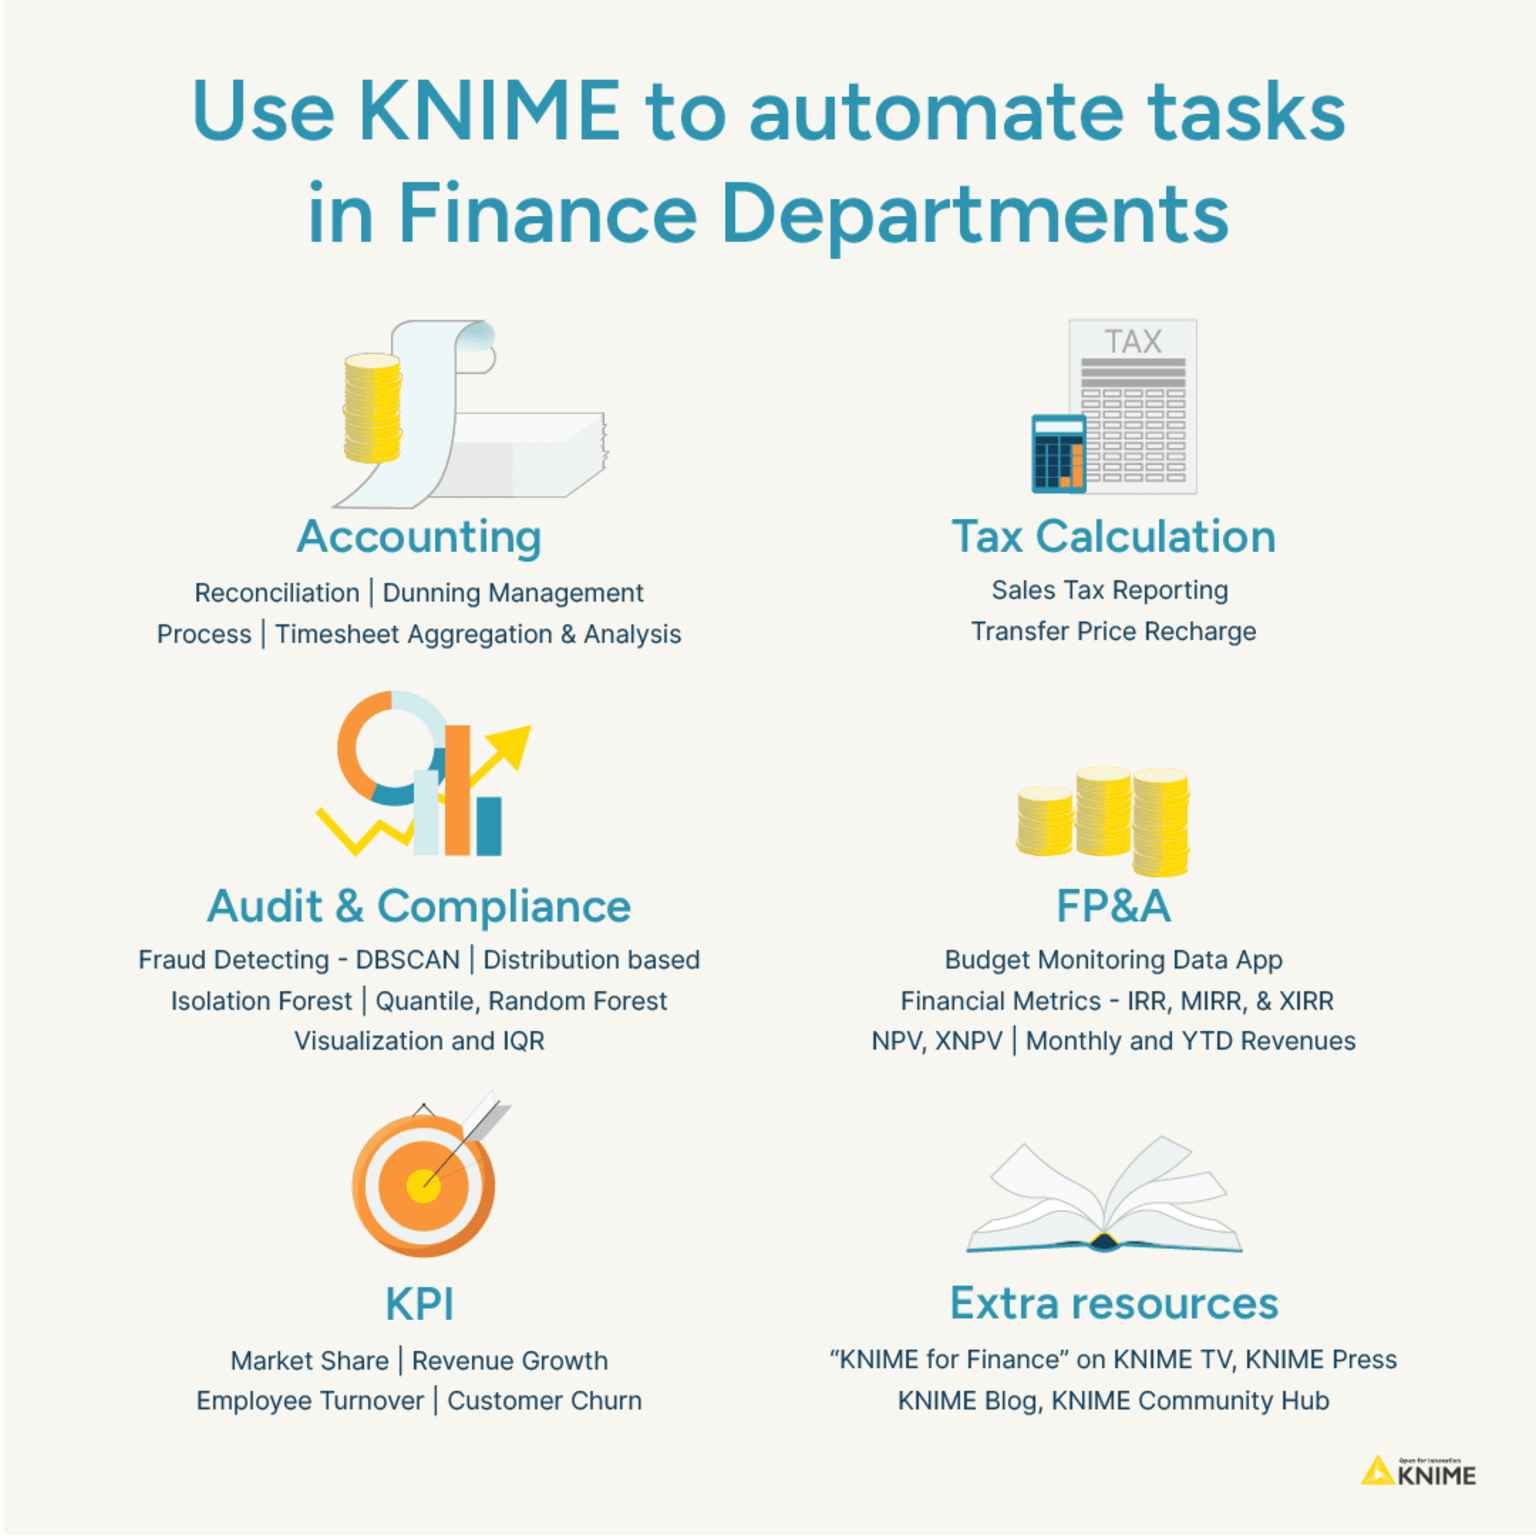
Some common use cases include:
- FP&A:
- Audit & Compliance:
- Fraud Detection using DBSCAN, Distribution based, Isolation Forest, Quantile, Random Forest, Visualization, and IQR
Financial Analysis Challenges
Financial Planning and Analysis (FP&A) teams face numerous challenges when implementing financial analysis solutions. Here are some common pain points and how KNIME can help address them:
1. Difficult Data Integration from Multiple Sources
Problem: FP&A teams often struggle with integrating financial data from various sources such as ERP systems, CRM databases, and Excel spreadsheets. Manually consolidating data from disparate sources leads to errors, inconsistencies, and delays in reporting.
Solution: KNIME Analytics Platform provides a visual workflow platform that allows FP&A teams to easily integrate data from multiple sources using a drag-and-drop interface.
With KNIME, you can automate the data integration process, ensuring accuracy and saving time. The first step in building an effective FP&A department involves integrating various financial activities into a single, cohesive system.
This can help you ensure that data flows smoothly between departments, reducing the risk of errors and improving the quality of financial insights. KNIME Analytics Platform has over 300+ built-in connectors to access any data. You can connect to:
- Databases
- Cloud services
- Various file formats
- ERP systems
- CRM software
- Web resources
- Big data platforms
- LLM model providers
KNIME can also handle data of any size or type- numerical data, categorical data, text, images, time-series data, or even network data.
Here are two cheat sheets that you might find helpful:
- Connectors with KNIME Analytics Platform which covers connections to external tools and data sources; and
- KNIME for Finance which includes useful nodes and components for common applications in finance departments
2. Poor Data Quality and Consistency
Problem: Ensuring data quality and consistency is a constant challenge for FP&A teams. Inaccurate or incomplete data leads to flawed analysis and unreliable insights, impacting decision-making.
Solution: KNIME offers a wide range of data access and transformation capabilities, allowing FP&A teams to identify and address data quality issues. With KNIME, you can standardize data formats, clean and blend your data by handling missing values, removing duplicates, detecting outliers, converting data types, filtering, sorting, aggregating, and grouping data for summarization and restructuring. Additionally, you can combine multiple sources and formats to efficiently prepare your data.
You can overcome these limitations by adopting KNIME Analytics Platform which enhances data integration, automates your financial analytics workflows, and offers sophisticated analytical functions, improving accuracy, reducing errors, and providing deeper insights for better decision-making and financial management.
3. Complex Financial Modeling
Problem: Building complex financial models can be time-consuming and error-prone. Traditional spreadsheet-based models are difficult to maintain and prone to errors, especially as complexity increases.
Solution: With KNIME, you can easily build and deploy sophisticated financial models. KNIME’s open platform allows you to access the most popular and most cutting-edge techniques on the market. Its intuitive, visual programming environment also allows you to perform every step of the data science lifecycle within one intuitive platform–from data ingestion and preprocessing to model development, validation, deployment, and monitoring.
You can identify trends, relationships, and outliers, enhance predictability and pattern analysis, and interpret your data with a wide range of statistical capabilities. You can choose from a wide range of machine-learning techniques, implement feature engineering, and selection, evaluate and fine-tune model performance with a comprehensive set of performance metrics and visualization tools, and finally deploy and monitor machine-learning models. KNIME makes it easy to perform complex financial calculations with accuracy and efficiency.

4. Slow Manual Reporting Processes
Problem: Manual reporting processes are inefficient and prone to errors. FP&A teams spend valuable time gathering, formatting, and distributing financial reports, detracting from more strategic activities.
Solution: With KNIME, you can use dynamic charts, graphs, and plots directly within workflows to spot trends, distributions, and correlations. You can choose from a wide selection of native charts & graphs to create bar charts, line charts, scatter plots, histograms, box plots, pie charts, heatmaps, and area charts. For more advanced visualizations, choose from geographical maps, treemaps, network graphs, parallel coordinates plots, violin plots, and sunburst charts.
By using visualization and reporting with KNIME you can share these insights as interactive, web-based data apps without the need to code. You can also automate the generation of reports with KNIME’s scheduling and reporting capabilities and customize these reports with branded templates, incorporating charts, tables, and textual summaries to communicate insights effectively. You can schedule reports to run at predefined intervals or trigger them based on specific events in your workflow.
You can also easily integrate KNIME with external reporting tools such as Tableau, Power BI, and Qlik for enhanced visualization and analysis and export data and visualizations in any popular format (e.g., PDF, HTML) or directly embed them into email.
5. Lack of Scalability
Problem: Traditional financial analysis solutions lack scalability, making it difficult to handle large volumes of data. As data volumes grow, performance issues arise, leading to delays in analysis and reporting.
Solution: KNIME is capable of handling large datasets and workflows of any complexity. Whether you are working on multiple complex financial processes or scheduling and automating report generation, KNIME scales with your needs, providing consistent performance and reliability.
Visual workflows make working with data intuitive and collaborative. The analytic depth and breadth of the platform ensure data scientists can leverage the most cutting-edge technology on the market, while still collaborating and sharing blueprints with peers with domain specializations.
You can build and deploy analytical models without any code. However, if you prefer to code, you can choose to easily package scripts and make them available as nodes for reuse by non-coders, making advanced analytical tasks and techniques more broadly accessible.
Getting Started with KNIME Analytics Platform
A low-code tool like KNIME Analytics Platform makes it easy for anyone to start using visual workflows for analysis. And it’s free to get started. Automate financial analytics and reallocate your time to what matters. Overcome manual data aggregation and eliminate errors by using KNIME in FP&A, financial controlling, treasury, tax, audit, and compliance.
Use pre-built financial analytics workflows
You don't have to start with a clean slate. Check out how KNIME powers finance teams across industries.
We have created a set of jump-start workflows for common operations in finance. All those blueprint workflows have been stored in a dedicated repository on the KNIME Community Hub, named KNIME for Finance, and are available for free download and usage.
We also have a cheat sheet that highlights the most important nodes and verified components you need to know when it comes to using KNIME for finance.
Why use KNIME Analytics Platform for financial analytics?
KNIME Analytics Platform is a low-code tool, suitable for employees who are not programmers but have a business background. KNIME Analytics Platform is also open source and free to download and use. It offers a large variety of connectors, all standardized, all presenting the same UI, making it very easy to connect to all types of data sources: databases, ERP systems, CRM software, web resources, files, cloud repositories, and more.
With the KNIME Community Hub, you can upskill, share your expertise, and collaborate on data science solutions. Join our active global community to learn the basics or get deeper into data science, discover community-built blueprints for your next project, or take the first steps into automatically running your analysis with a subscription plan.
Collaborate and automate financial analytics work with KNIME Business Hub
KNIME Business Hub, the commercial counterpart of KNIME Analytics Platform, allows for collaboration, productionization, and scheduling of all implemented operations. Which means it allows for automation. This is very practical in finance departments, as you can generate the report you need on Monday morning, regularly, using the latest data, on time, and at a low cost, without any manual work.
These examples just scratch the surface of what is possible when organizations incorporate spreadsheets with a low-code data analytics platform like KNIME. Take the first step towards transforming your financial analysis workflows by downloading the KNIME Analytics Platform today.
Explore more Resources:
- Ebook: KNIME, Automation, and AI: The KNIME for Finance Collection
- Eguide: Why finance teams are moving from spreadsheets to low-code data analytics
- Eguide: How KNIME Helps Finance Departments Automate and Optimize FP&A Work
- Cheat Sheet: KNIME for Spreadsheet Users
- KNIME for Finance Youtube Playlist
- KNIME for Finance Community Hub Space with pre-built workflows
- KNIME for Finance: Introducing AI to Finance Departments
- KNIME for Finance: Customer churn KPI
- KNIME for Finance: Transfer pricing recharge
- KNIME for Finance: Monthly and year-to-date revenue aggregations
- KNIME for Finance: Sales tax reporting
- KNIME for Finance: Invoice and dunning process management