
Dr. Carsten Lange is a Professor of Economics at Cal Poly Pomona. His area of speciality is machine learning and AI. His machine learning expertise has been key to the successful execution of projects from economic impact studies for the City of Industry, analyzing the European debt crisis, through to predicting Major League Baseball pitcher salaries with AI.
Here, he talks about how to avoid common ML pitfalls and increase the generalizability of machine learning models i.e., your model’s ability to adapt properly to new data.
In machine learning, splitting data into training and test sets is a broadly accepted practice, but conceptual pitfalls can creep into the process and impact the model’s ability to perform its purpose on new data - i.e. data that was not used to train and test the model. If the model has not learned the true relationship between features and target outcomes it is less likely to produce accurate results.
This article will show how to avoid these three pitfalls when splitting a dataset:
- Overfitting
- Data leakage
- Incorrect usage of normalization
I will illustrate the concepts with some examples using the open source, low-code KNIME Analytics Platform. While the demos shown here use KNIME, the underlying principles apply to programming languages such as R and Python as well.
KNIME provides a comprehensive set of tools (nodes) to explore, transform, and analyze data with a visual interface via drag-and-drop. KNIME Analytics Platform is open source so free to download. Once installed on your computer, you can access and download the workflows for this article linked to from the related figure titles, or from my public space on KNIME Community Hub.
Pitfall 1: Overfitting
What is overfitting?
Overfitting occurs when your model gives accurate predictions for the training data, but not for new data. Overfitting is more likely when a non-linear prediction function is trained with a small sample from the population data. Unfortunately, having only a small sample dataset combined with a highly non-linear prediction function is a common setup in real-world machine learning applications.
How to avoid overfitting?
To avoid overfitting, it is crucial to split the overall data into a training and a testing dataset. The training dataset is used to optimize the model, while the testing observations are set aside to assess the predictive quality of a machine learning model after it is fully optimized. Note, that a testing dataset cannot be used for any kind of optimization of a model — including hyperparameter tuning (!!!).
Apart from a few exceptions (e.g., time series analysis), the observations assigned to the training and testing datasets are randomly drawn from all available observations.
As a rule of thumb, about 10% — 40% of the total observations should be assigned to the testing dataset. The remaining observations are used to train the model.
Let’s have a look at what overfitting looks like demonstrated in a couple of graphs.
The screenshot below shows the estimate from a Polynomial Regression to predict the relationship between a house's square footage (Sqft) and its price (Price) based on 20 observations.
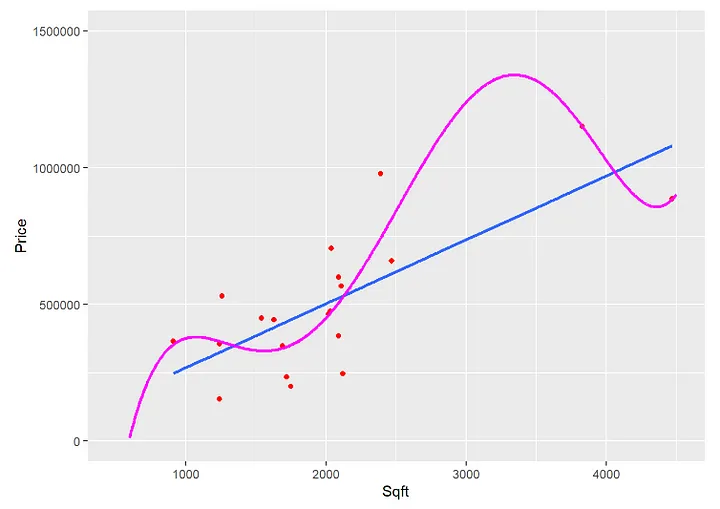
The graph shows a polynomial function and a linear function predicting 20 data points. The underlying polynomial prediction function for the graph is:
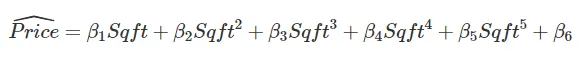
As the graph shows, the polynomial function (magenta) does a pretty good job of approximating the 20 observations compared to a linear function (blue). The reason is that the non-linearity together with the six parameters of the Polynomial Regression (β₁ — β₆ ) allows the function to bend in many ways resulting in a good approximation of the 20 data points.
However, the situation looks very different if we look at the second graph.
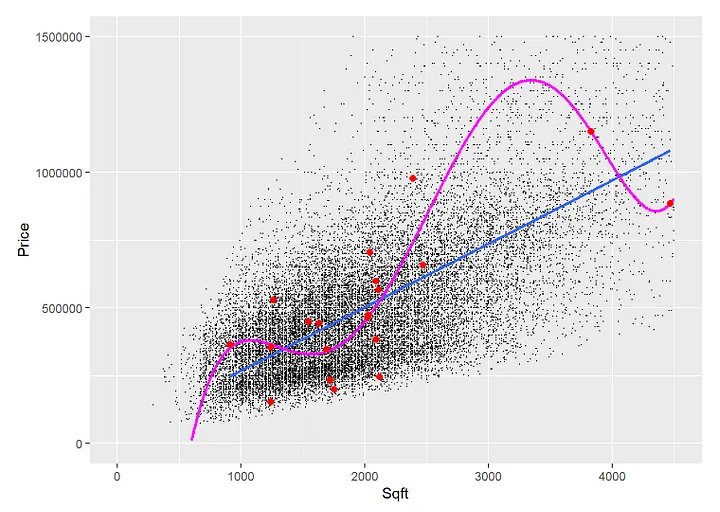
Here, in addition to the 20 training observations, you can see all other observations that were not used for the training.
The polynomial prediction approximates the 20 training data well. However, it fails to predict the other data it was not trained on (the example is from Practical Machine Learning with R: Tutorials and Case Studies). That's overfitting.
Pitfall 2: Data leakage
What is data leakage?
Data leakage occurs when information from the testing dataset leaks into the training dataset (note the direction: from testing → training).
To better understand data leakage, you can think of a math exam in high school. The teacher gives out 20 questions for students to train for the exam and sets aside 7 other questions for the exam — the testing data.
If students get some information (e.g., the wording of some questions) from the exam, they can use this information when training for the test. Information leaks from the exam questions (testing data) into the preparation questions (training data). Consequently, the exam will not be a good assessment of students’ math skills anymore. The students might even have learned the results of the leaked question by heart without understanding the underlying topic.
In our machine learning model, when choosing observations randomly from the total observations to be assigned to either the training or the testing dataset, there are two options:
- Drawing with replacement (e.g., Bootstrapping) or
- Drawing without replacement.
The first option, Drawing with Replacement, is likely to cause data leakage.
When creating a training and testing dataset and drawing observations from the original dataset with replacement, some observations might not be drawn for either the training or testing dataset, while others will be present in both datasets.
The latter observations, which are present in both the training and the testing dataset, cause a problem when training the model: these observations are used twice, to assess the predictive quality of the model and to train the model. To a certain degree, we assess approximation to the training data rather than predictive quality.
How to avoid data leakage?
To avoid data leakage, normalization and other data transformation tasks must be executed after the data has been partitioned into training and testing data.
Tip: Fortunately, programs like KNIME, R, and Python use procedures that generate random training and testing datasets by Drawing without Replacement.
In real-world applications, data leakage often occurs in a subtle manner, making it harder to detect. Let’s have a look at an example.
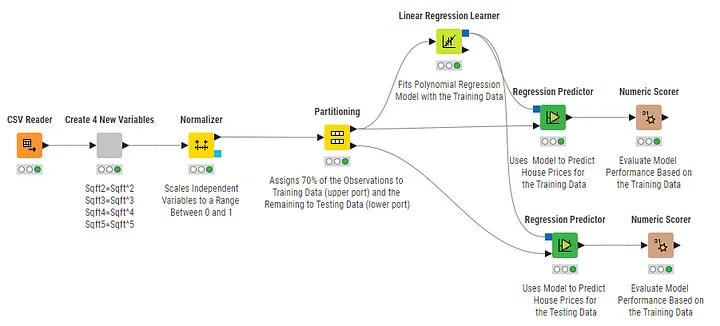
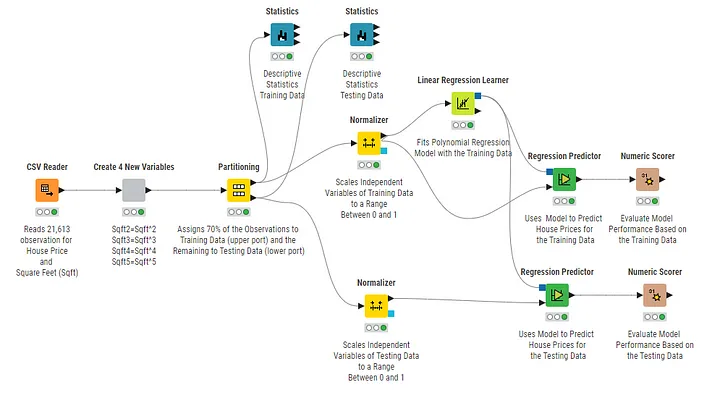
The KNIME workflow (which you can download here from KNIME Community Hub) starts by reading a dataset of 21,613 observations with house prices and the related square footage. Next, four new variables are generated from Sqft for the Polynomial Regression according to Equation (1) based on the Sqft powers from 2–5.
Before the KNIME Partition node is executed to randomly assign 15,129 (70%) observations to the training data and the remaining 6,484 observations to the testing data, the Normalizer node is used to scale the independent variables to a range between 0 and 1.
Polynomial Regression does not require scaling. However, the independent variables (the various powers of Sqft in our case) are often scaled to make the resulting regression coefficients comparable and also for numerical reasons.
To scale a variable value xᵢ to a new variable value yᵢ within a range between 0 and 1, the original variable’s values xᵢ, their minimum xₘᵢₙ, and their maximum xₘₐₓ are used as follows:
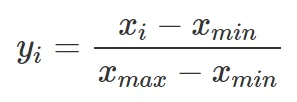
The way the scaling procedure is implemented in the workflow of Figure 3 may cause data leakage.
This is because the smallest and the biggest values for each variable (the xₘᵢₙ and the xₘₐₓ) are determined from the complete dataset.
Consequently, the observations related to xₘᵢₙ and the xₘₐₓ could be from observations that later get assigned to the testing dataset.
If this happens, we scale the training data with xₘᵢₙ and the xₘₐₓ values that originate from observations that are part of the testing dataset.
Therefore, information from the testing data is used and included in the training data, which constitutes data leakage. Consequently: Normalization and other data transformation tasks must be executed after the data has been partitioned into training and testing data.
Pitfall 3: Using normalization incorrectly on training and testing data
In the example below, we fixed the problem of data leakage by normalizing the training and testing data after partitioning. No information leaks from the testing data into the training data — no data leakage.
But a new problem has arisen: we’ve used normalization incorrectly.
What is normalization?
Normalization is a preprocessing step to adjust data to a consistent scale to ensure all values are proportionate and without distorting differences in the range of values or losing information. It’s an important step to improve the performance and training stability of machine learning models.
In our example, the polynomial model is trained with variables that are scaled based on the minimum and maximum values from the training dataset (xₘᵢₙ, ₜᵣₐᵢₙ and xₘₐₓ, ₜᵣₐᵢₙ) which per see is not a problem.
However, the fitted model’s prediction quality is assessed with a testing dataset scaled with different values (xₘᵢₙ, ₜₑₛₜ and when xₘₐₓ, ₜₑₛₜ).
We cannot expect a good performance on the testing data when the scaling is different to the scaling for the training data i.e., the data used to optimize the model.
Let’s look at why this causes a problem.
The problem occurs with all five variables used in the polynomial regression, but we will demonstrate it only for one of the variables (Sqft).
The minimum and maximum for Sqft in the training dataset are xₘᵢₙ, ₜᵣₐᵢₙ = 290 and xₘₐₓ, ₜᵣₐᵢₙ = 13,540 (you can verify these values in KNIME by clicking on the related Statistics node in the workflow from Figure 4). These values are then used to scale the training data, which are subsequently used to train the model.
In contrast, for the testing dataset xₘᵢₙ, ₜₑₛₜ = 390, and xₘₐₓ, ₜₑₛₜ = 9,200. How can we expect to get good prediction results for the testing data, if they were scaled with different xₘᵢₙ and xₘₐₓ values than the ones we used to train the model?
How to use normalization correctly on training and testing data
Testing data must be scaled with the same xₘᵢₙ and the same xₘₐₓ values as the training data. Otherwise, performance on the testing data might be sub-optimal.
The solution is to apply xₘᵢₙ and xₘₐₓ Values from the Training Dataset for the Scaling of the Testing Data
The workflow in Figure 5 shows how xₘᵢₙ, ₜᵣₐᵢₙ and xₘₐₓ, ₜᵣₐᵢₙ can be used to scale the testing data.
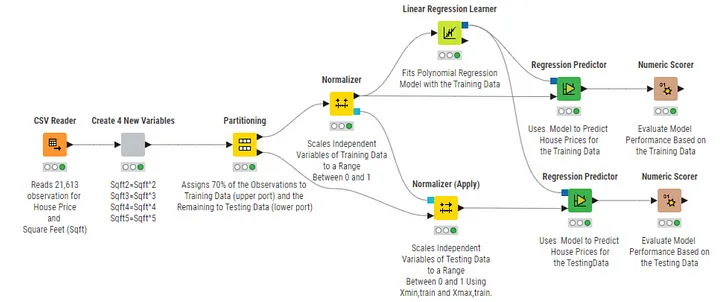
Training data and testing data are scaled separately. Therefore no data leakage occurs.
After the Normalizer node scales the training data, the resulting xₘᵢₙ, ₜᵣₐᵢₙ and xₘₐₓ, ₜᵣₐᵢₙ values are generated at the output port of the Normalizer node and then used as an input for the Normalizer (Apply) node (see the blue Model ports). The Normalizer (Apply) node then applies xₘᵢₙ, ₜᵣₐᵢₙ and xₘₐₓ, ₜᵣₐᵢₙ to normalize the testing data (thus the name Normalizer (Apply)).
Now that training and testing data have been normalized with the same xₘᵢₙ and xₘₐₓ values, we can expect an improvement in the testing data error.
Indeed, when clicking on the Numerical Scorer nodes in KNIME for the workflows from Figures 4 and 5 for the testing data, you can see that the Mean Square Error (MSE) for the testing data has improved from 2.62 ⋅ 10¹¹ to 6.43 ⋅ 10¹⁰ after scaling was correctly applied in the workflow of Figure 5. The MSE for the training data is the same for the workflows shown in Figures 4 and 5.
One question remains: Was data leakage introduced by using information from the training data to scale the testing data?
The answer is: No, because Data Leakage occurs when information from the testing data leaks into the training data, not the other way around.
Key takeaways to avoid overfitting, data leakage, and incorrect usage of normalization
- A research dataset must be split into a training and testing dataset to avoid overfitting
- Normalization and other data transformations must be applied after the data is split in training and testing to avoid data leakage
- When normalizing the testing data, the parameters from the training data (in our case: xₘᵢₙ, ₜᵣₐᵢₙ and xₘₐₓ, ₜᵣₐᵢₙ) should be applied to the testing data normalization procedure. Otherwise, differently, pre-processed data are used for training and testing.
Happy Analytics!
This is a revised version of the original article, first publised in Low Code for Data Science.