
This is part of a series of articles to show you solutions to common finance tasks related to financial planning, accounting, tax calculations, and auditing, all implemented with the low-code KNIME Analytics Platform.
Timely access to accurate financial indicators is paramount for informed decision-making. However, the manual calculation of these indicators often proves to be a bottleneck, introducing inefficiencies, inconsistencies, and delays. FP&A analysts are tasked with bridging the gap between raw data and actionable insights and need efficient solutions to streamline the process.
The ability to use key financial metrics is a crucial skill that enables FP&A analysts to make informed decisions quickly and adapt with agility to market fluctuations. Automating financial calculations not only saves time but also enhances accuracy, providing a strategic edge to businesses.
Mydral, an organization with expertise in consulting and specialized in data visualisation and understanding, has developed models using the low-code KNIME Analytics Platform to automate the financial calculation of the five essential metrics every FP&A analyst needs:
- Internal Rate of Return (IRR)
- Modified Internal Rate of Return (MIRR)
- Extended Internal Rate of Return (XIRR)
- Net Present Value (NPV)
- Extended Net Present Value (XNPV)
Let's delve into these five essential financial models, which are all available to download from the Financial Analysis space on KNIME Community Hub, and see how KNIME simplifies the process.
Watch the videos and find a detailed write-up below.
The task: Evaluate investment feasibility with KNIME
KNIME Analytics Platform is a powerful tool that can be used to automate and optimize financial calculations. The task at hand involves automating the evaluation of investment feasibility, a crucial aspect of financial analysis. Traditional methods of assessing investment opportunities involve cumbersome manual calculations of metrics such as IRR, MIRR, XIRR, NPV, and XNPV. These calculations not only consume valuable time but are also prone to errors, potentially leading to flawed decision-making.
By leveraging KNIME's intuitive interface and comprehensive suite of tools, FP&A analysts can simplify and accelerate the process of investment feasibility analysis. The platform's drag-and-drop functionality allows analysts to build customized workflows tailored to their specific requirements. With nodes dedicated to each financial model, including IRR, MIRR, XIRR, NPV, and XNPV, KNIME facilitates the automation of these calculations with ease.
Furthermore, KNIME's integration capabilities enable seamless connectivity with various data sources, ensuring that the analysis is based on up-to-date and reliable information. Whether it's incorporating data from databases, spreadsheets, or external APIs, KNIME provides the flexibility to adapt to diverse data environments.
The workflow: 5 components to assess the profitability and viability of investment projects
There are different types of investments we can make:
- Personal investments on individual projects
- Regular financial investments, where we invest a regular sum of money e.g. once a month, and
- Random financial investments, which are usually riskier, non-regular investments
Let's look at the five components developed by Mydral to evaluate investment feasibility.
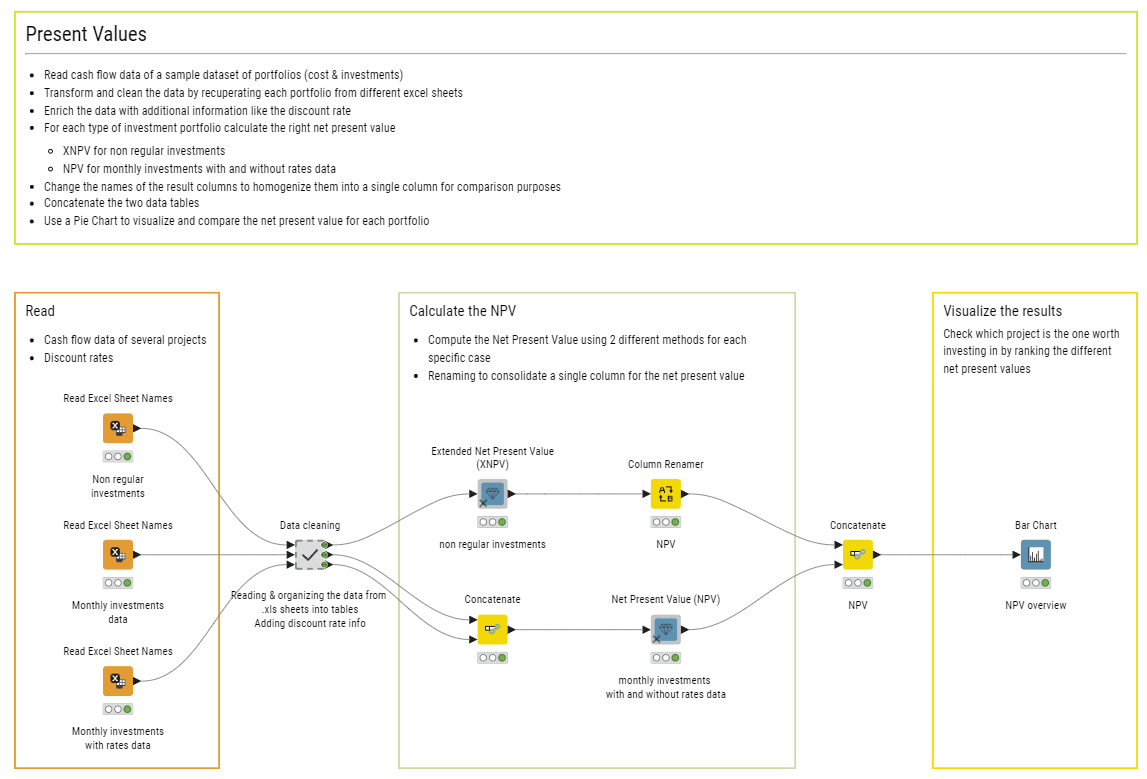
Use Net Present Value (NPV) and Extended Net Present Value (XNPV) in KNIME
The Net Present Value (NPV) component helps you to evaluate an investment based on the highest value at a given rate. This calculation gives you the value of the expected future income stream, determined as of the date of valuation. The NPV is typically used to evaluate personal investments and regular financial investments.
The Extended Net Present Value (XNPV) component is more suitable for evaluating random financial investments. This also calculates the NPV, but the calculation is based on specific dates.
You can use the NPV and XNPV components in your workflows. First read the cash flow data for the proposed investments, apply cleaning and standardization for each cash flow, then use the NPV component to calculate the metric. Finally, visualize the results.
Explore the example workflow, Financial Metrics - NPV & XNPV, available for free on KNIME Community Hub, which demonstrates how to use the NPV and XNPV components.
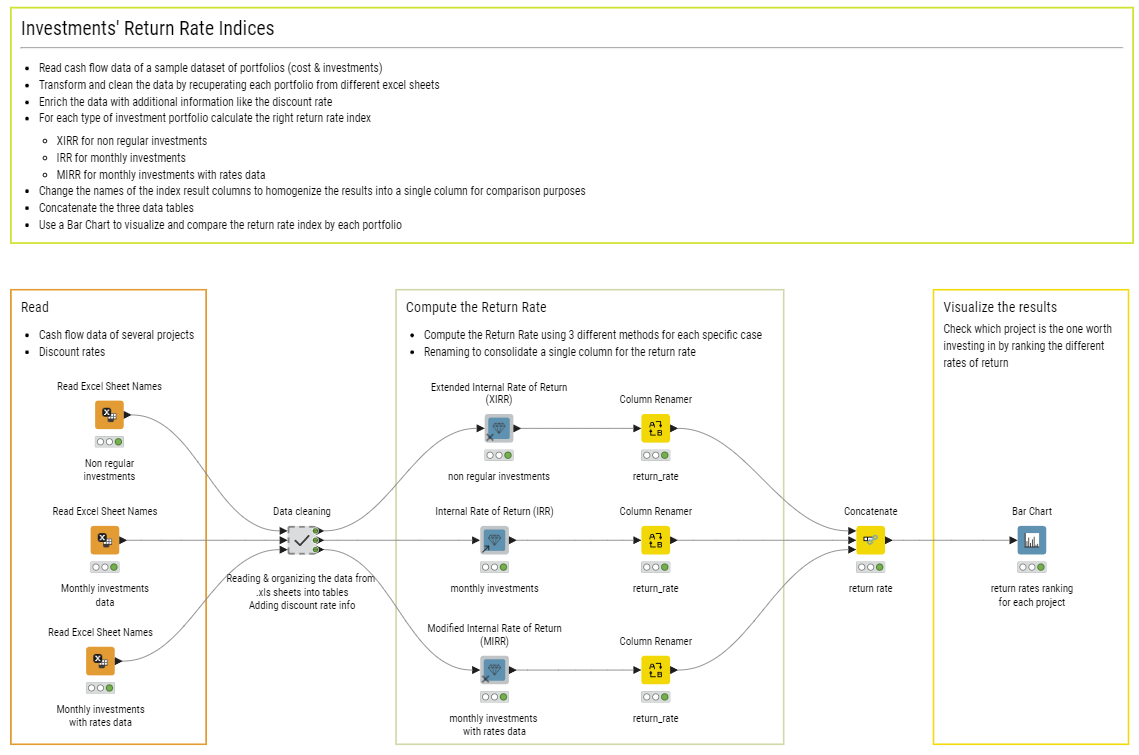
Use Internal Rate of Return (IRR), Modified Internal Rate of Return (MRR), and Extended Internal Rate of Return (XIRR) in KNIME
Let's have a look at evaluating investment feasibility with the metrics IRR, MRR, and XIRR.
The component for Internal Rate of Return (IRR) on an investment or project calculates the rate of return when the net present value of all cash flows (both positive and negative) from the investment is assumed to be equal to zero. This is useful for evaluating monthly investments where we don't need to specify any date.
The Modified Internal Rate of Return (MIRR) component calculates the IRR taking into account the finance rate and the reinvestment rate. This is useful for evaluating monthly investments with rates data.
The Extended Internal Rate of Return (XIRR) calculates the IRR at a specific date. This metric is typically used for evaluating random investments.
You can plug these components into your KNIME workflow, read the cash flow data for the investment, apply cleaning and standardization for each cash flow, and then apply the components to calculate the metric.
Explore the example workflow, Financial Metrics - IRR, MRR & XIRR, available for free on KNIME Community Hub, which demonstrates how to use the IRR, MIRR and XIRR components.
The results: Visualize your investment feasibility evaluation
Now we have all return rates from all these investments. We put all of them together, and then we visualize them using a bar chart. And from the bar chart, it is immediately visible which investment project has the highest return rate. This makes the work of a financial analyst faster and easier.
Why KNIME for Finance
KNIME's low-code environment ensures that even users with limited programming experience can leverage its capabilities effectively. This democratization of financial analysis empowers FP&A teams to focus their efforts on interpreting results and deriving actionable insights rather than getting bogged down by manual calculations.