In this blog series we’ll be experimenting with the most interesting blends of data and tools. Whether it’s mixing traditional sources with modern data lakes, open-source devops on the cloud with protected internal legacy tools, SQL with noSQL, web-wisdom-of-the-crowd with in-house handwritten notes, or IoT sensor data with idle chatting, we’re curious to find out: will they blend? Want to find out what happens when IBM Watson meets Google News, Hadoop Hive meets Excel, R meets Python, or MS Word meets MongoDB?
Today: SparkSQL meets HiveQL: Women, Men, and Age in the State of Maine
After seeing the foliage in Maine, I seriously gave a thought of moving up there in the beauty of nature and in the peace of a quieter life. I then started doing some research on Maine, its economy and its population.
As it happens, I do have the sampled demographics data for the state of Maine for the years 2009-2014, as part of the CENSUS dataset.
I have the whole CENSUS dataset stored on a Apache Hive installation on a Cloudera cluster running on the Amazon cloud. It could then be processed on Apache Hive or on Apache Spark using the KNIME Big Data Extensions.
KNIME Big Data Extensions offer a variety of nodes to execute Apache Spark or Apache Hive scripts. Hive execution relies on the nodes for in-database processing. Spark execution has its dedicated nodes. However, it also provides an SQL integration to run SQL queries on the Apache Spark execution engine.
We set our goal here to investigate the age distribution of Maine residents, men and women, using SQL queries. On Apache Hive or on Apache Spark? Why not both? We could use SparkSQL to extract men’s age distribution and HiveQL to extract women’s age distribution. We could then compare the two distributions and see if they show any difference.
But the main question, as usual, is: will SparkSQL queries and HiveQL queries blend?
Topic. Age distribution for men and women in the US state of Maine
Challenge. Blend results from Hive SQL and Spark SQL queries.
Access Mode. Apache Spark and Apache Hive nodes for SQL processing
The Experiment
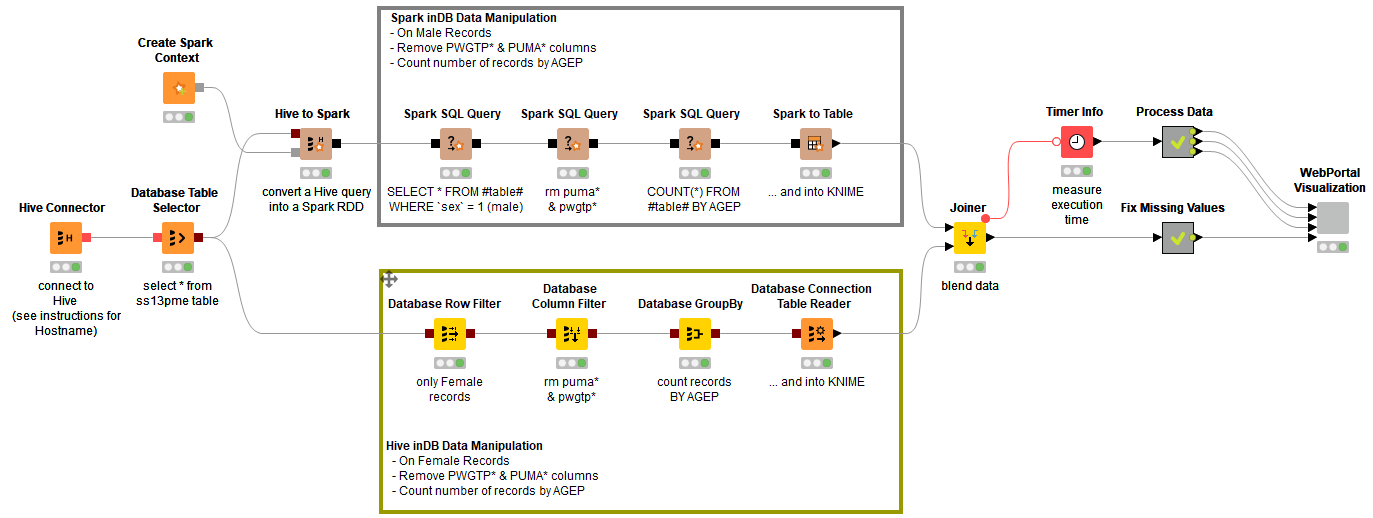
To explore age distributions of women and men living in Maine, we designed a workflow with two branches: the upper branch aggregates the age distribution of men using Spark SQL; the lower branch aggregates the age distribution of women using Hive SQL.

1. Connecting to Hive
Table ss13pme, stored in an Apache Hive database, contains the CENSUS data of 1% of the Maine population over the 5 years following 2009, a total of circa 60k records. The workflow starts by connecting to the Apache Hive database with a Hive Connector node followed by a Database Table Selector node.
At this point, the data flow follows two separate paths: one path will work on women’s records and one path on men’s records; one path will work with Spark SQL queries and one path with Hive SQL queries.
2. Spark SQL queries to process men’s records
Then we build the SQL query with the help of a few Spark SQL nodes. A generic Spark SQL Query node extracts all men’s records (sex = 1); then another generic SQL Query node removes less important columns; finally the last Spark SQL Query node counts the number of records by age.
3. Hive SQL queries to process women’s records
In the lower branch the data continue to flow on the Hadoop Hive platform. Again, here an SQL query extracts women’s records (sex = 2), removes unimportant columns, and counts records by age. The assembling of the full SQL query is obtained with a Database Row Filter node, a Database Column Filter node, and a Database GroupBy node.
At the end, the Database Connector Table Reader node executes the SQL query on the platform selected by the Database Connector node - i.e. the Apache Hive platform where the CENSUS data has been stored – and exports the results into a KNIME data table.
Note. The sequence of Database yellow nodes in the lower branch only builds the required SQL query string, but does not execute it. It is the final node of the sequence – Database Connector Table Reader– that executes the query and gets the job done.
Similarly, the sequence of Spark SQL nodes in the upper branch only builds the sequence of required DataFrames without executing them. It is the final node of the sequence – Spark to Table – that executes the DataFrames and gets the job done.
4. Data Blending & Visualization
The blending of the results of the execution of the two SQL queries is carried out by the Joiner node inside KNIME Analytics Platform, which joins men and women counts on age values.
In order to cover possible age holes in the original data, the demographics table is left-joined with an ad-hoc table including all ages between 0 and 100 in the Fix Missing Values metanode.
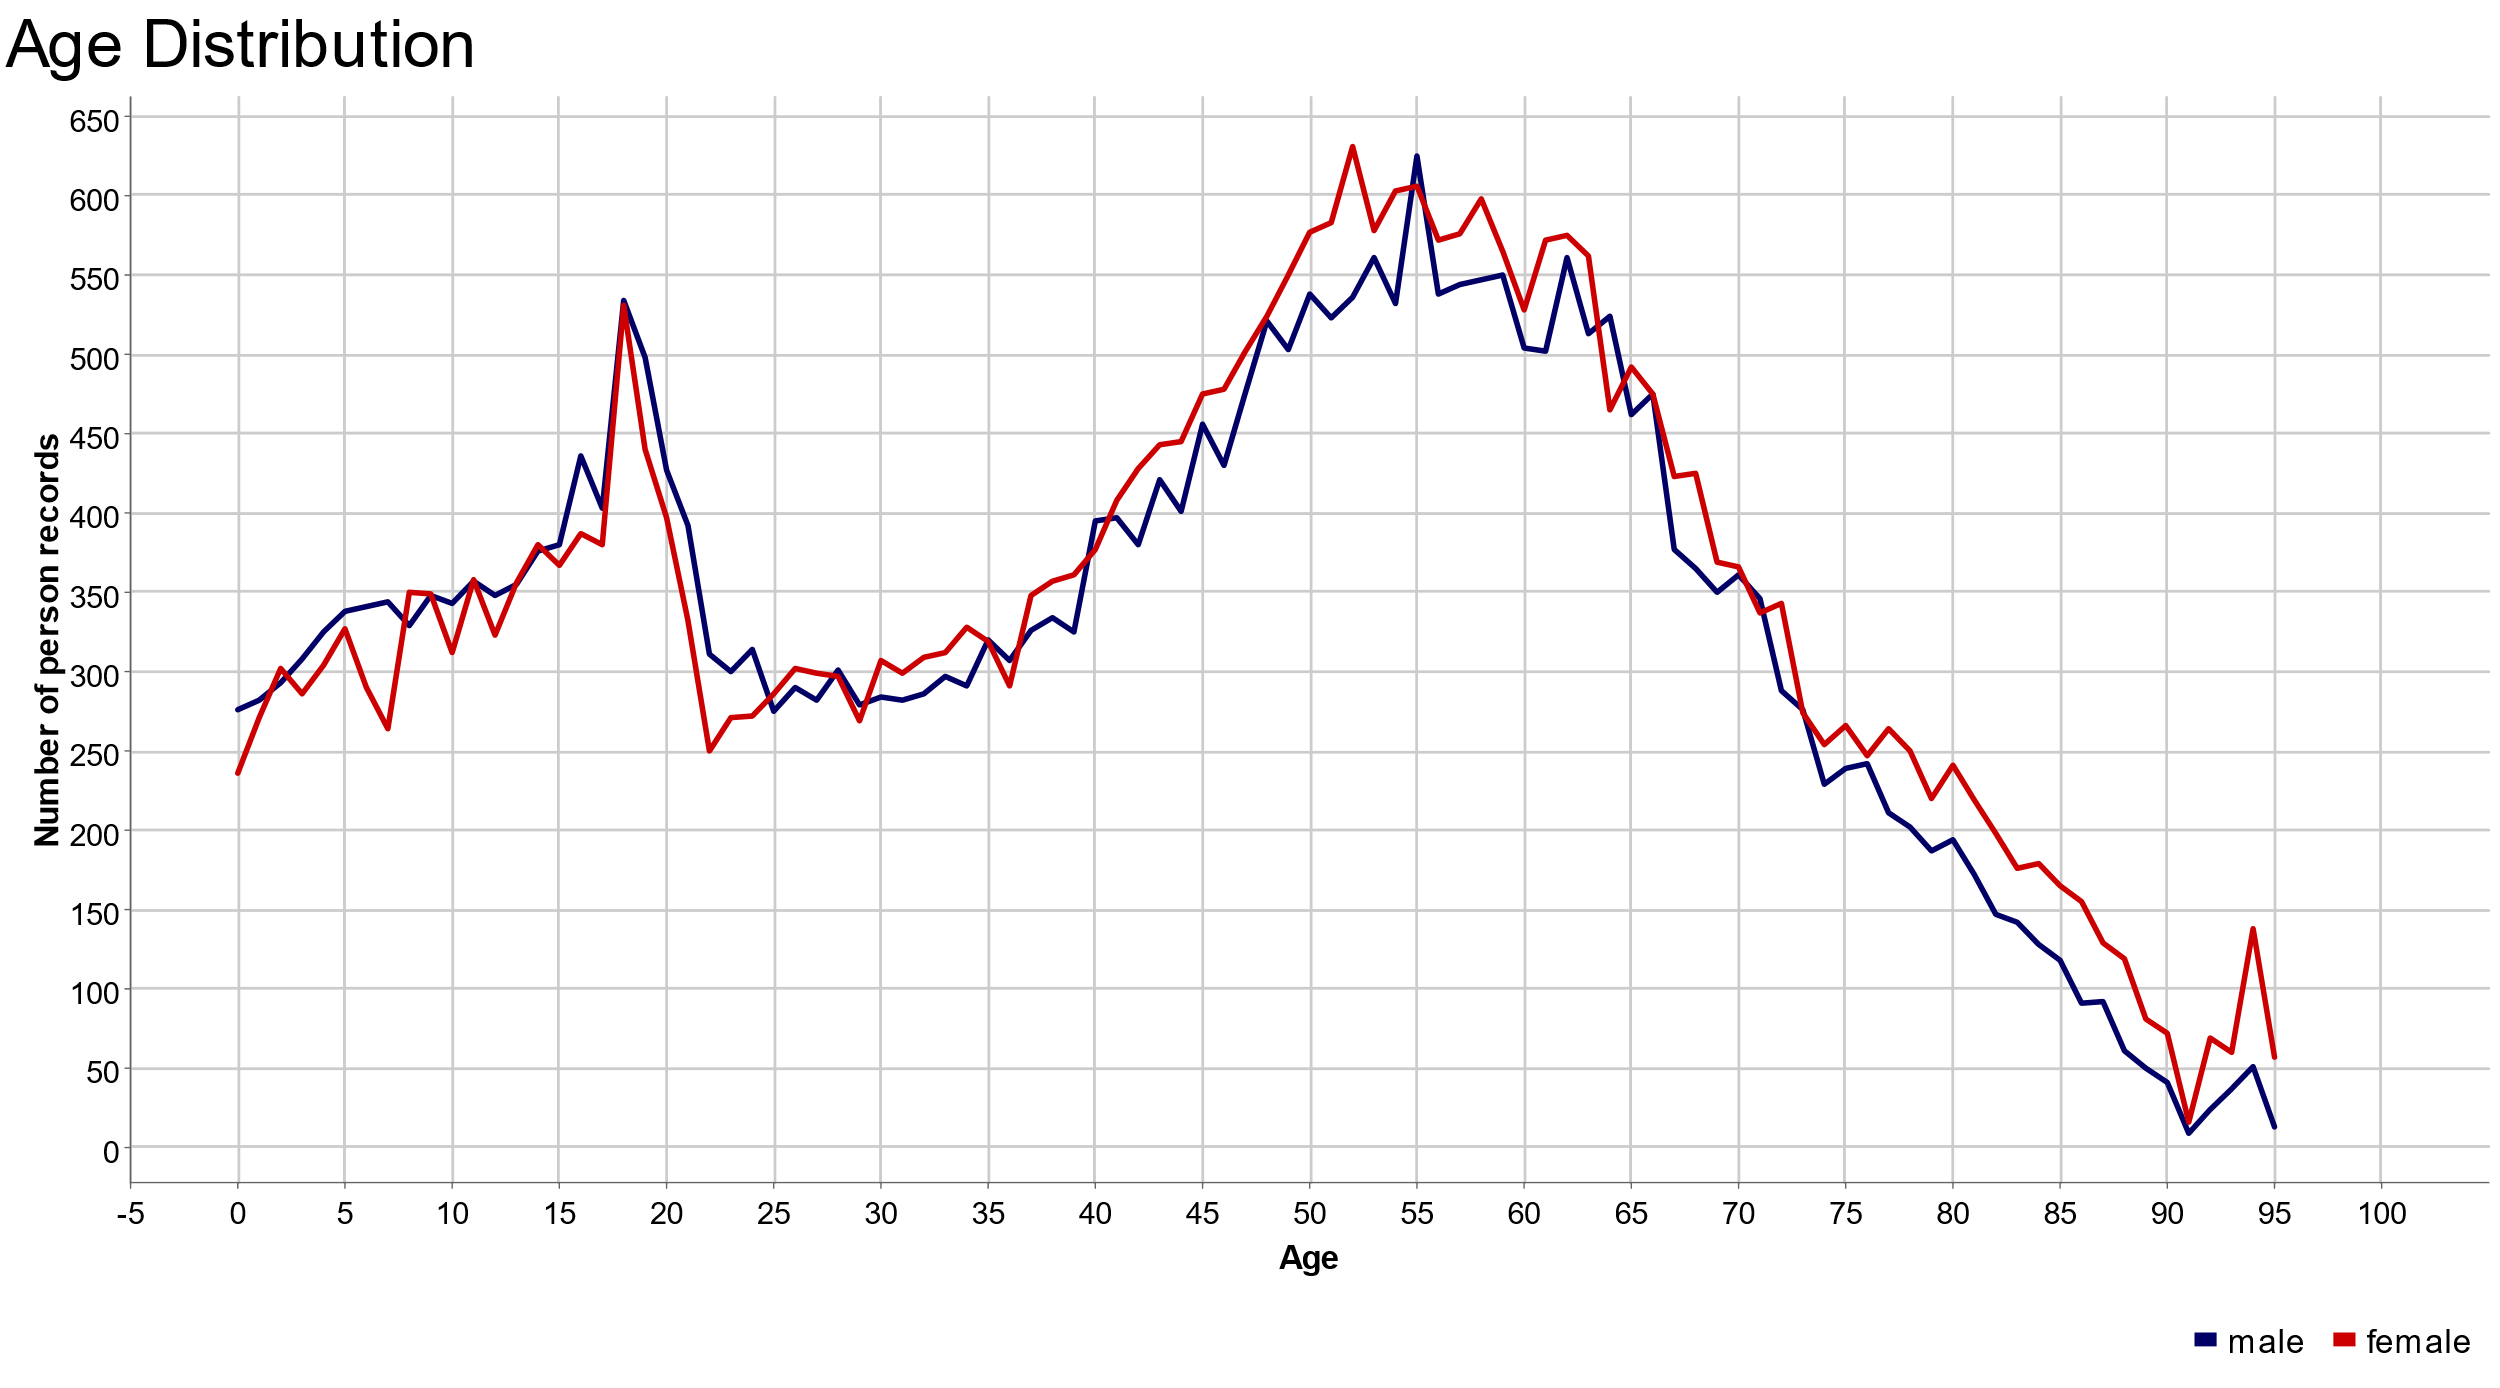
The final node of the workflow, named WebPortal Visualization, produces a line plot for both age distributions through a JavaScript Line Plot node (Fig. 2).
Note. Packing the JavaScript visualization node into a wrapped metanode automatically makes the plots also visible and controllable from the KNIME WebPortal.
The whole workflow, calculating the age distribution for men through Spark SQL and the age distribution for women through Hive SQL, is displayed in figure 1 and is downloadable from the KNIME EXAMPLES server under 10_Big_Data/02_Spark_Executor/07_SparkSQL_meets_HiveQ10_Big_Data/02_Spark_Executor/07_SparkSQL_meets_HiveQ*.
The Results
Maine is one of the smallest states inside the USA. Its economy has not been blooming for decades. It is not really a place where people move for a career advancement step, but rather for studying or retiring.
The WebPortal interactive page displaying the two age plots is shown in figure 2. On the y-axis we have the absolute number of people; on the x-axis the corresponding age values.

In the line plot above, women (in red) and men (in blue) are similarly distributed in age. No major differences are observed between the two distributions of men’s and women’s population in the State of Maine.
Two peaks are clearly identifiable: one covering the ages between 17 and 22 (students) and a larger plateau covering the ages between 50 and 70 (retired). People in working age, such as between 24 and 45 year old, are less prominent in both age distributions. This might be related to the lack of jobs in the area.
But the most important conclusion is: Yes, they blend! Spark SQL and HiveQL SQL scripts can be used together in a KNIME workflow and their results do blend!
Authors: Rosaria Silipo and Anna Martin
Coming Next …
If you enjoyed this, please share this generously and let us know your ideas for future blends.
We’re looking forward to the next challenge. There we will try to blend real data with just realistic data. Will they blend?
