Journal entries to the ledger reflect the company’s financial status and provide the basis for informed decision-making. Inaccuracies can result in seriously skewed financial decisions based on misleading information.
Financial reporting analysts have the tedious but business-critical responsibility to prepare, review and approve these ledgers, and produce compliance reports for regulators. What often makes the process so tedious is the inflexibility of the multiple hard-coded rules in the spreadsheets they work in. Integrating spreadsheets into company information systems via IT for reporting purposes, for example, quickly becomes complex and time-consuming.
Changing just a single rule involves changing the entire process and is error prone. Typically this requires opening a ticket with IT and waiting. Depending on workloads it can take days until the change is implemented.
With automation flagged as one of the biggest efficiency opportunities in the financial services industry, the solution is to use a data science approach and replace manual rules that require IT with rule-based automation financial analysts can do themselves.
Shift your mindset from cells to data flows
Whether you realize it or not, in Excel you’re constantly defining a process for how you work with data. You clean it, you filter it, etc. What you’re left with, however, is just a table, and no historical record of what happened to that table. You’ve lost your process, and next time, have to repeat it.
More advanced tools give you both. The process that you’ve set and the resulting table. This shift from thinking only about the table, to both, the process and the table, opens up a world of efficiency.
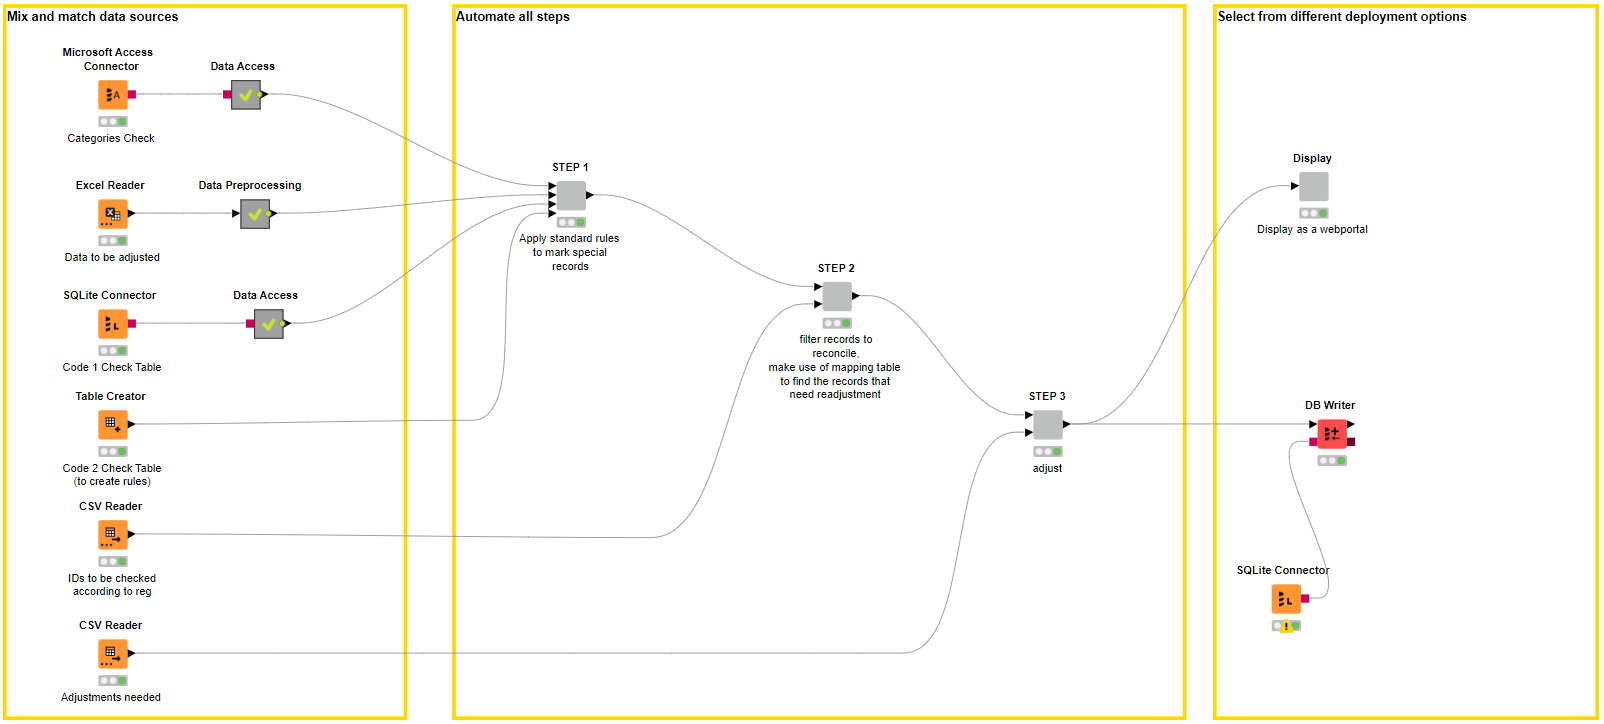
In KNIME, for example, you visually see the process via a workflow.

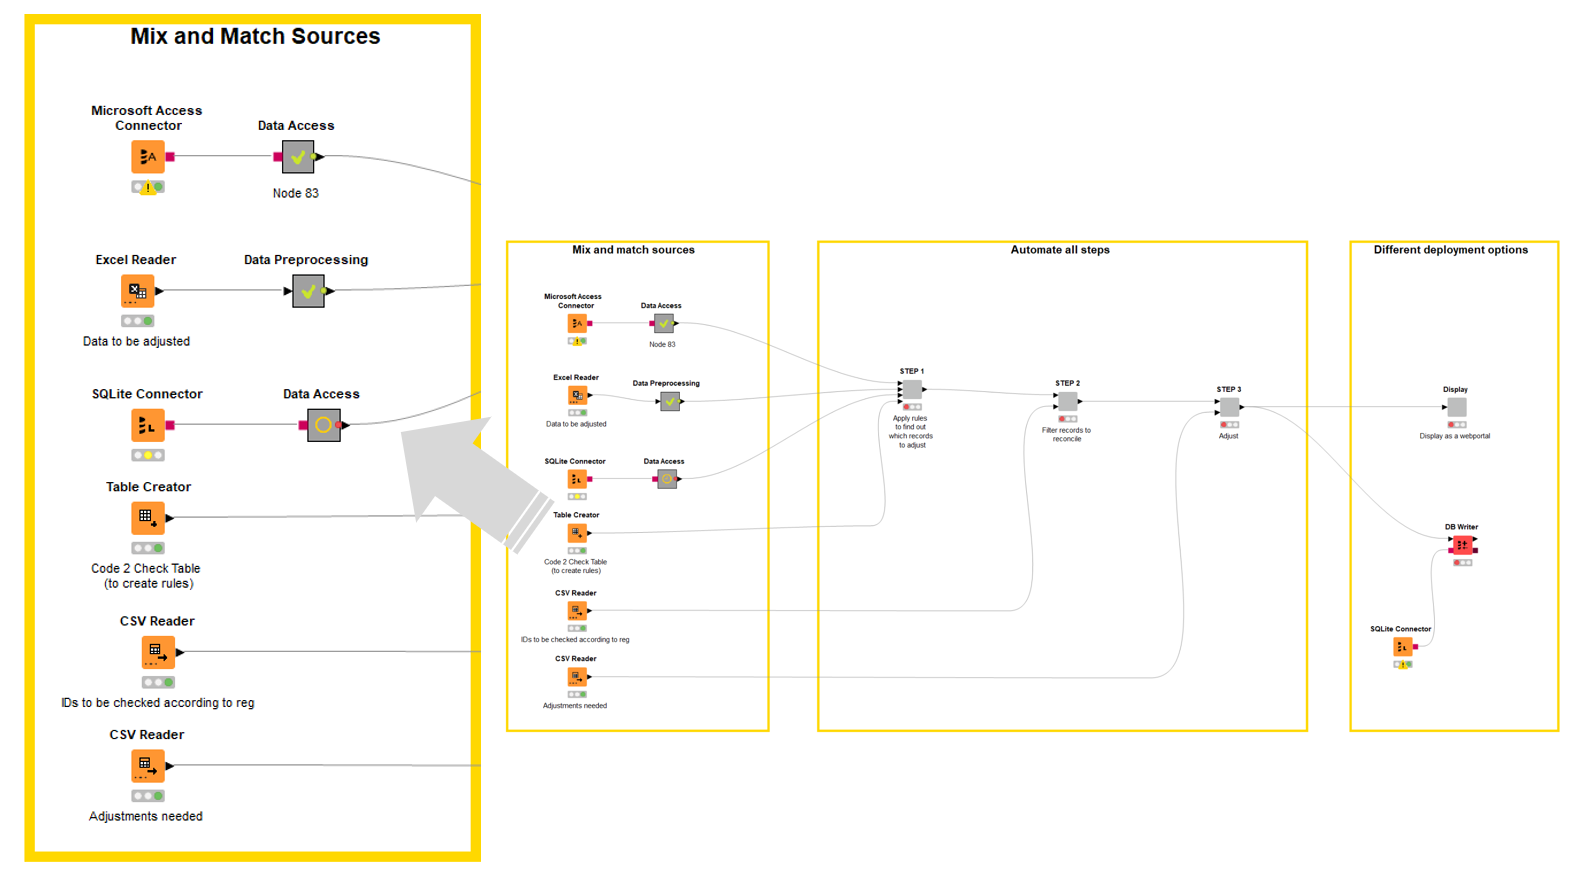
With the data effectively underlying the formulas now, the visual programming environment in KNIME makes this sequence of operations really easy to follow. You know how hard it can be to decipher formulas in spreadsheets that sometimes extend over multiple rows. But in our workflow, arrows take you from node to node; explanatory notes can be inserted underneath each step of the process; longer annotations can be added around multiple nodes.
The inherent good documentation of the process provides transparency, easier sharing and re-application of processes throughout the team.
But the biggest difference to Excel is that KNIME gives teams a full data science framework. Most notably: The ability to automate processes, connect to disparate sources, and integrate easily with third-party information systems or new technologies as required.
Increase process efficiency: from days to minutes
So to follow the data science approach, ledger rules are defined, applied, and adjusted automatically by a so-called rule engine in the workflow. Maintained in a single table, any rule-change means simply updating one table. With new rules now in place, mismatches can be automatically flagged and a list output of all the records that don’t comply with regulator rules.
The efficiency improvement in the automated process is significant. Twelve hours of work is reduced to minutes.
Compare figures: across multiple data sources and formats
While the Sales division of a bank might be using Salesforce, Finance is maintaining figures in Excel on Sharepoint or GoogleDrive. Accessing and comparing data across sources and formats, or maintaining figures in multiple places is a real pain.
A single KNIME workflow can orchestrate accessing and merging the different data sources and formats. This makes it easy to compare, adjust, and verify all the data across the board.

Eliminate error: ledger maintenance in one place
When the Sales division reports a deal worth $1 million in Salesforce and Finance raises a hand to say well actually it’s $999,999 in Excel, you can have all the relevant data sources adjusted automatically via the “Adjustment” table in the workflow. This table calculates how much is needed to make the other data sources correct: Execute the workflow and all values are subsequently updated.
Schedule the workflow to run, say once a week, and all new figures are adjusted automatically.
Free up time: automated compliance reports
Following review and approval of the entries, ledger compliance reports have to be sent to the regulator. The open and integrative KNIME Analytics Platform easily allows different reporting options. You can continue working within the preferred set-up, legacy systems, email services, or start integrating new technologies.
For example, you can schedule the workflow to run at regular intervals and automatically email a report to the regulator. Alternatively, configure it to write the report to a specific database, an Excel file, or to a location in the cloud.
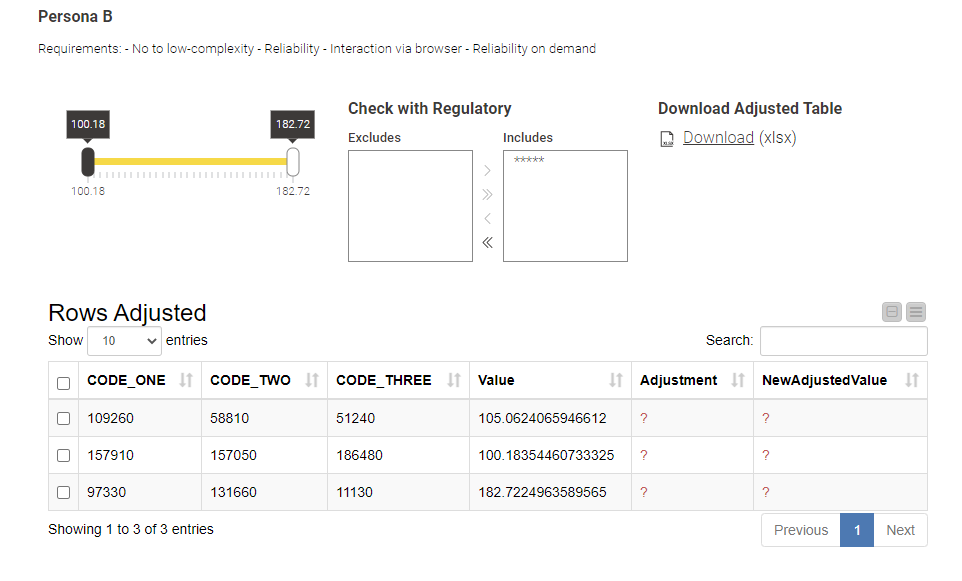
Reports can also be sent to a browser-based data app, to be audited by managers. Your manager can access and download reports as required (no need to request reports by email) and interact with the data app to query different figures, for example, or filter the output for closer inspection.

Take control: reduced risk of errors
With the process previously highly IT dependent, the low level of involvement of the financial analyst also posed a risk. Now that the financial analyst team is able to build and own their processes, the subject matter experts are (back) in control.
The example workflow shown in this article is publicly available in the Financial Services & Banking space on the KNIME Hub. Download and adapt it to your own ledger compliance requirements.
You, as the subject matter expert, have the knowledge to see mistakes in the data quickly, thus reducing the risk of errors. When you want to tweak the process for example, just adjust the workflow, run it, and immediately check the output of each node - the output of each single step. In contrast to IT, you have the subject matter expertise to verify the impact of the tweak on the data right away, and if necessary tweak the workflow a little more to get the right result.
A solution that ticks all the boxes
The typical specifications required by financial analyst teams at banks: automation, auditability, data security, performance, and collaboration are all covered by the KNIME solution. Look up the Financial Services & Banking space on the KNIME Hub to find the workflow from this article plus two more to download and adapt to your own data and use case. Or read more about Data-Powered Financial Services & Banking with KNIME.
Tip! Try out two new verified components developed by Ana Vedoveli for financial reporting analysts:
- Measure Fractional Years computes the fraction of the year of the difference between two dates, similar to the YEARFRAC function in Excel
- Invert Category Sign inverts the signs of the values attached to given categories
