This is part of a series of articles to show you solutions to common finance tasks related to financial planning, accounting, tax calculations, and auditing, all implemented with the low-code KNIME Analytics Platform.
Transfer pricing recharge refers to the internal process within a multi-entity corporation where one subsidiary charges another subsidiary for goods, services, or intellectual property transferred between them.
It helps multinational corporations determine fair prices for transferred assets and services. It also helps these corporations maintain transparency and compliance with tax regulations by preventing price manipulation for tax avoidance purposes. Transfer pricing recharge is a crucial aspect of managing intercompany transactions, ensuring a balanced distribution of resources, and fostering accountability within the complex framework of a global business structure.
Companies take care of cost allocation for transfer pricing by initially identifying and categorizing costs associated with specific activities or projects. This process often involves meticulous spreadsheet analysis, where direct costs like materials and labor, along with indirect costs such as overhead, are allocated based on the resources consumed by each division or project.
The drawback of manual spreadsheet analysis lies in the potential for errors, time-consuming data entry, and the complexity of managing large datasets.
With the KNIME Analytics Platform such repetitive spreadsheet tasks can be automated, the accuracy of the analysis improved and it allows for collaboration with ease. Insights can be obtained faster with the low-code/no-code interface.
Let's see how KNIME helps.
The task: Transfer pricing recharge with the cost-plus method
We will demonstrate a KNIME solution for transfer pricing recharge that uses the cost-plus method. Support functions e.g. in the headquarters (HQ) incur cost based on work that benefits other entities. Based on the arm's length principle of transfer pricing, services that are performed in favor of the other entities need to be recharged to the entities with a market price.
In this example, they are to be recharged to the entities based on cost drivers which are Headcount and Revenue.
On a high level, the transfer pricing and cost allocation process we showcase includes the following steps:
- Extract accounting data from multiple sources (ERP and CRM systems, Files, Databases, etc.):
- Data of Costs, which should be recharged;
- Headcount and Revenue Figures
- Calculate the charge with the specified markup* value
- Calculate how much of the different costs should be assigned to each entity in %
- Calculate recharges by entity
- Save all bookings into a sheet or write to a database
- Visualize recharges per country for each selected account
- Create Accounting Bookings to be uploaded to ERP
*Note: In the domain of transfer pricing, a markup refers to the additional percentage or amount added to the cost of a product or service, needed to determine its transfer price.
The data can be pulled using any of the KNIME connectors. You can collect data from ERP systems such as SAP using the SAP Reader node, out of Odoo using the GET Request node, out of a database using the DB nodes, or simply out of an Excel file using the Excel Reader node. For the purposes of this article, we’ve built a workflow that takes data from an Excel file. This is so that you can download the workflow and try it out immediately.
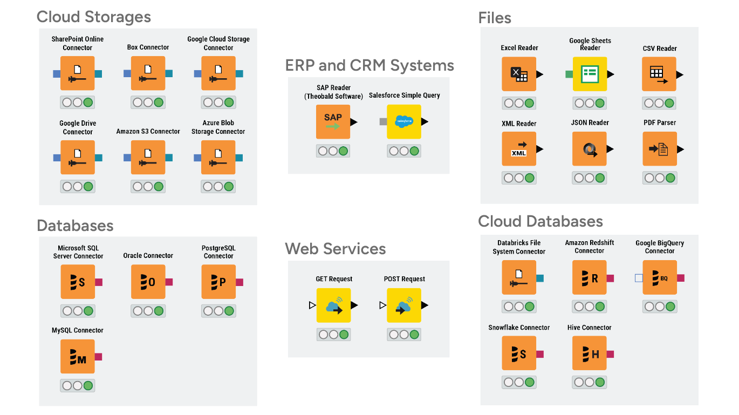
In order to make this example work on everybody’s laptop, without the need of accounts and credentials, we use sample Excel files or Table Creator node as our source of the data:

A dummy file, created with Table Creator node, containing Headcount and Revenue Figures per entity.

The workflow: Transfer pricing recharge
The workflows for Transfer Pricing Recharge are available and free to download from the KNIME Community Hub.
Let’s walk through the static workflow first and then we will show you how to turn it into a dynamic data app.Transfer Pricing Recharge - Static Workflow
You can download the Transfer Pricing Recharge – Static workflow here.
The workflow for the described use case can be observed below. On a high level it consists of 3 steps, two of which are handled by workflows collected into components
Tip: Learn what a component is and how to create and reuse them in these videos:
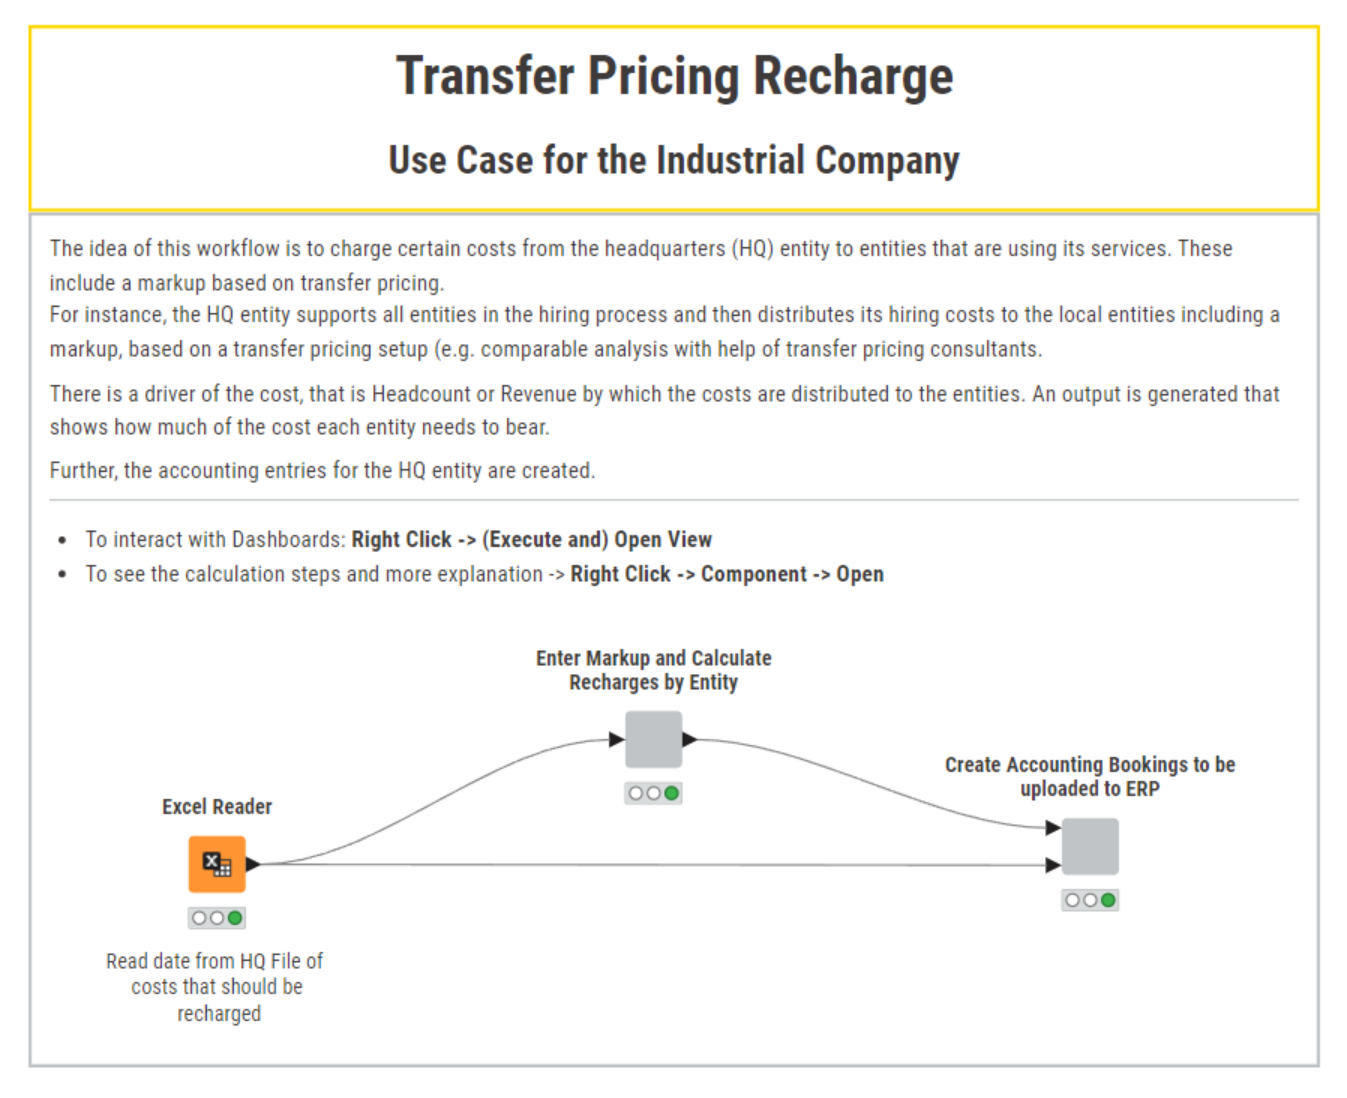
The steps of the workflow:
- First, we read the cost data from HQ.
- Second, inside the component “Enter Markup and Calculate Recharges by Entity” various nodes are used to calculate recharges by entity based on the static markup value. The bookings information is then being saved locally and displayed in a form of table and pie chart.
- Third, within the component “Create Accounting Bookings to be uploaded to ERP” we create a final table to be uploaded to ERP and save it.
Let’s look inside of the components in more detail.
A component to enter markup and calculate recharges by entity
We've documented the component structuring it into different blocks, for eaiser understanding. You can see the overview below. It consists of five blocks of action.

1. Calculate the charge with the fixed markup value.
Here, we use GroupBy node to calculate total costs for each account, using the Costs Data. And, then, we recharge it with the static markup value, specified in the Math Formula node (15%):

Note: stay tuned to see how we can make markup value specification dynamic!
2. Calculate how much of the different costs should be assigned to each entity in %
Here, within the metanode “Aggregate & Transform '', we calculate the sum across all entities for HC and Revenue in kUSD, separately and convert those values to flow variables Headcount (HC) and Revenue for further calculations.
Next, we use the Math Formula nodes to divide HC by Total HC and, consequently, Revenue by Total Revenue, for each entity.
3. Calculate recharges by entity
In a nutshell in this block, we combine two branches from above and generate the data table where we can see the recharge by entity.
How do we do that?
To allow the input data to have various numbers of accounts, i.e. and not just the 5 in this example, we use the Table Column To Variable node to convert all values in the “Recharge with Markup” column to flow variables for further calculation. Since this node will call the flow variables with the RowID column values, for the sake of understanding, we use a RowID node before, which replaces RowID values with the ones from the “Account” column.
Then with a very powerful KNIME node – Column Expression – we create 5 expressions, which you can see in the figure below.
The reasoning behind those calculations is the following: We have various cost drivers and we also have various activities. Based on economic cost allocation logic we identify which cost driver drives which activity.
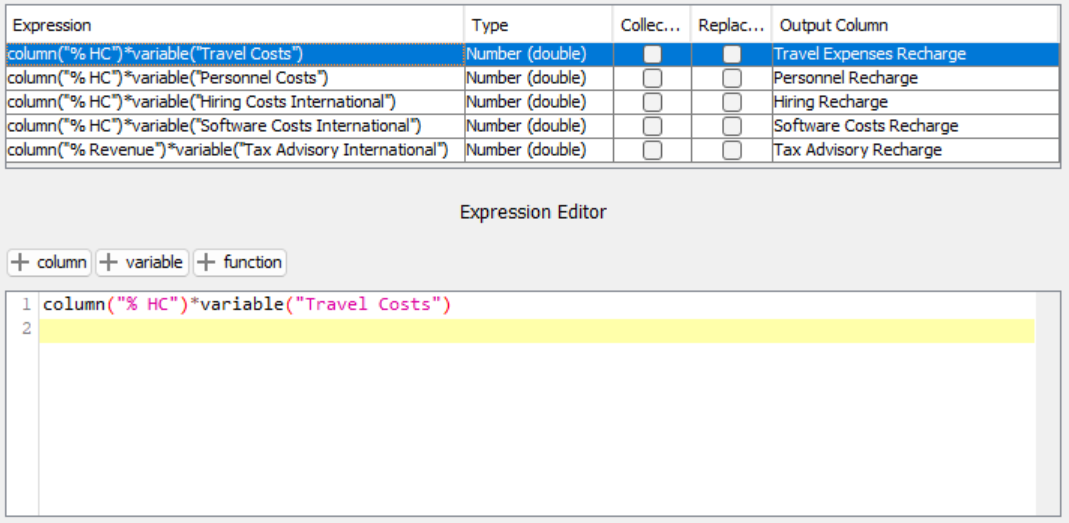
Then, we round the calculated Recharges to the full USD values, keep only relevant columns and filter out the US HQ row, as no booking is needed against itself.
4. Save the resulting table
We write the data into an excel sheet, but that could be any other data source.
5. Visualize results in a dashboard
We create visualizations to be displayed in the component’s view: final table and the pie chart with Recharges per Entity. You can view the results of calculations in the table below.

A component to create the accounting booking and upload it to the ERP system
The second component is dedicated to creating a correctly formatted accounting entry (see below). It has two input ports: one comes from the previous component and contains the data table with Recharges by Entity; second connects to the first imported Costs Data.
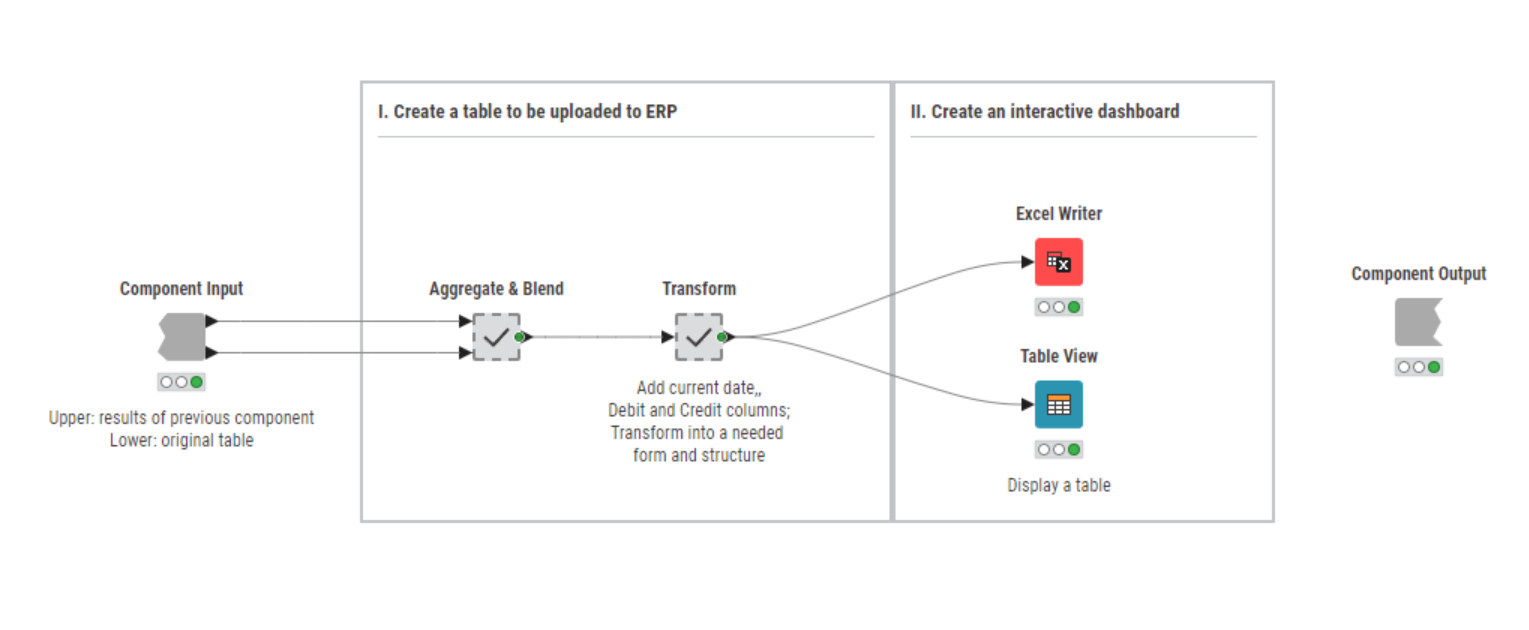
In the Aggregate & Blend metanode we remove repeated columns, transpose the table and calculate the sum by cost type, i.e. for each Account’s Recharge. We then rename the “Account” values for documentary purposes and, then, we join this resulting table with the original table with totals calculated.
Inside the second metanode “Transform” we add:
- the current date to each entry - to mark the date of booking;
- “Debit” and “Credit” columns to specify from which accounts we credit and to which we debit;
- and the column “Booking Text” with the constant values “Intercompany Recharge”, for documentary purposes.
And here we have it, the final table:
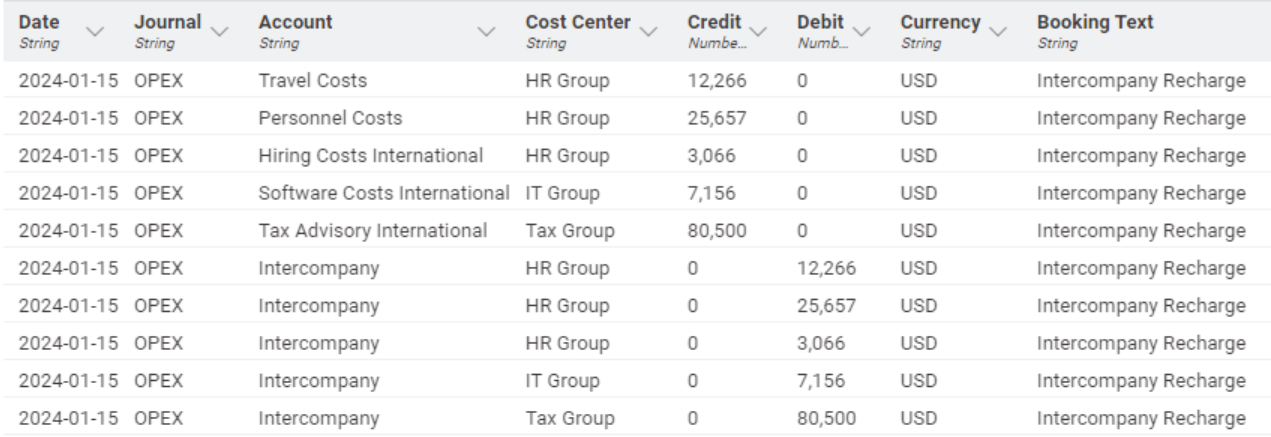
As a last step of this component, we save this resulting table as an .xlsx file, imitating the upload to ERP.
A data app for transfer pricing recharge
Wouldn't it be nice to have this workflow change dynamically, depending on a non-technical user input? For instance, if an accountant needs to specify new markup values, they would be able to do this via a simple user interface in a browser-based data app, without having to access the underlying workflow.
We want to enable the user to specify the markup value, control for which account the pie chart displays the recharges, and download the final report. We’ll use Widget nodes:
- To allow the user to specify the markup value (in %) that should come on top of costs incurred by the HQ entry, we have to adjust the first component by adding the Integer Widget node and the Refresh Button Widget node, to trigger re-execution. The value specified by a user would then as a flow variable overwrite the markup value used for calculations in the Math Formula node.
- To allow the user to select for which account to display recharges per entity in the Pie Chart node, we add the Column Selection Widget node to the first component.
- To allow the user to download the table prepared for ERP, in the second component we add the File Download Widget node.
We add headers to both components with Text View nodes. We also give our data app a final touch by adding a flowchart header. This is handled by the Data App Flowchart component. Below you can see both components with widgets added.
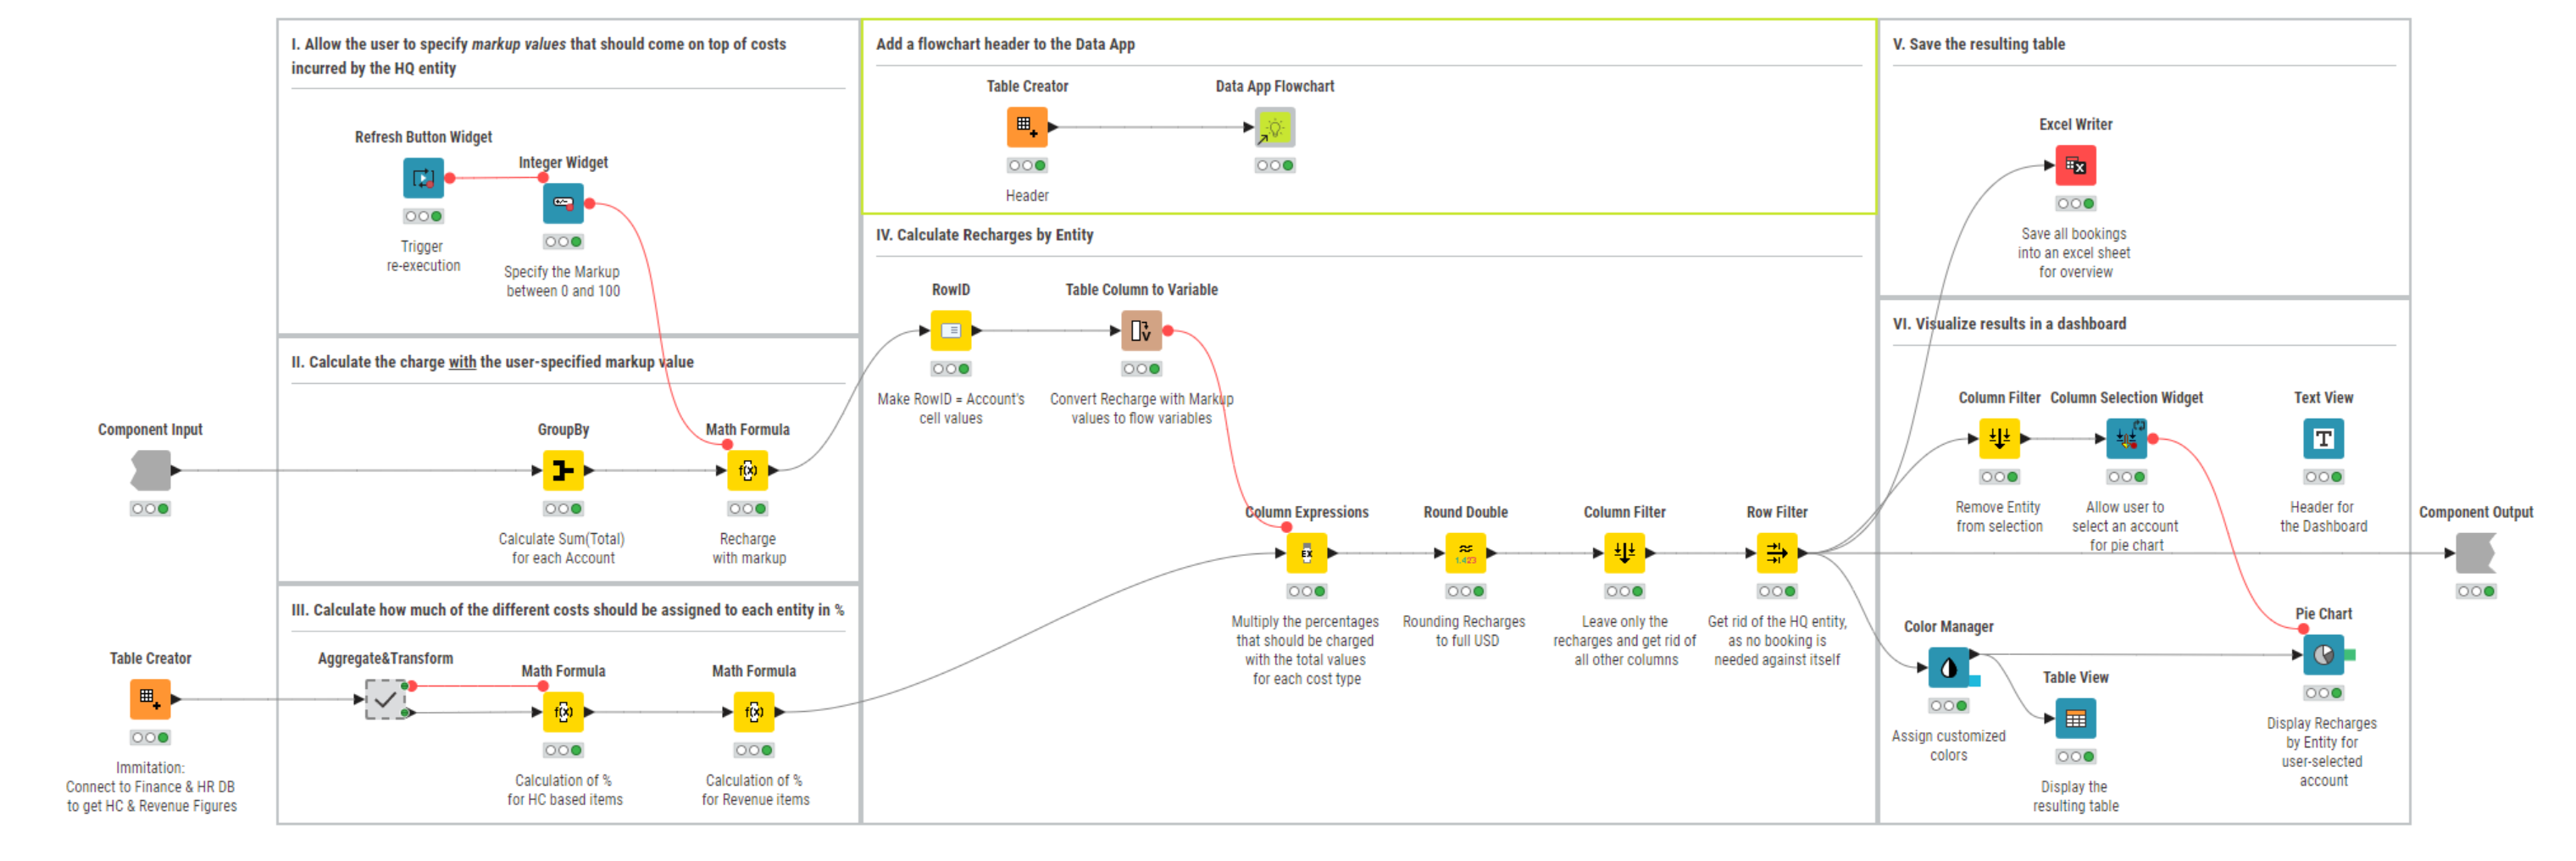
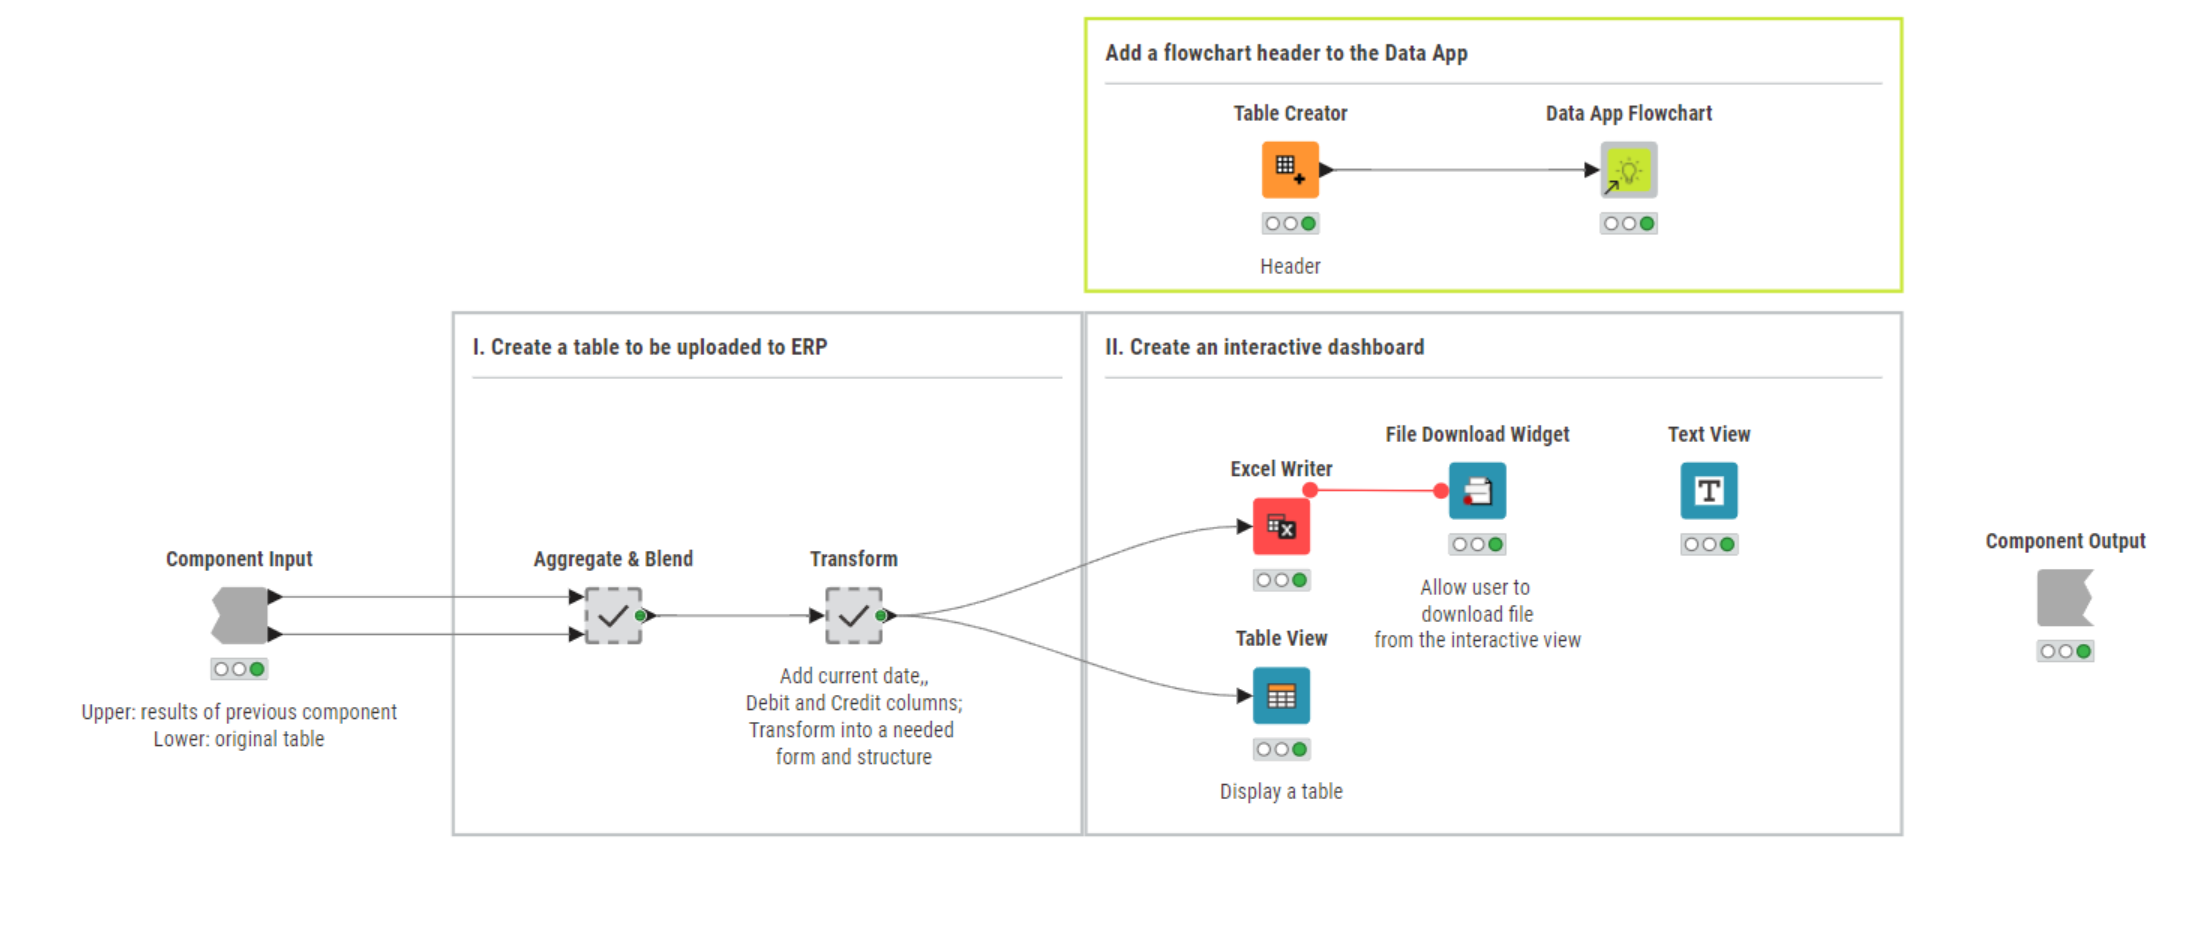
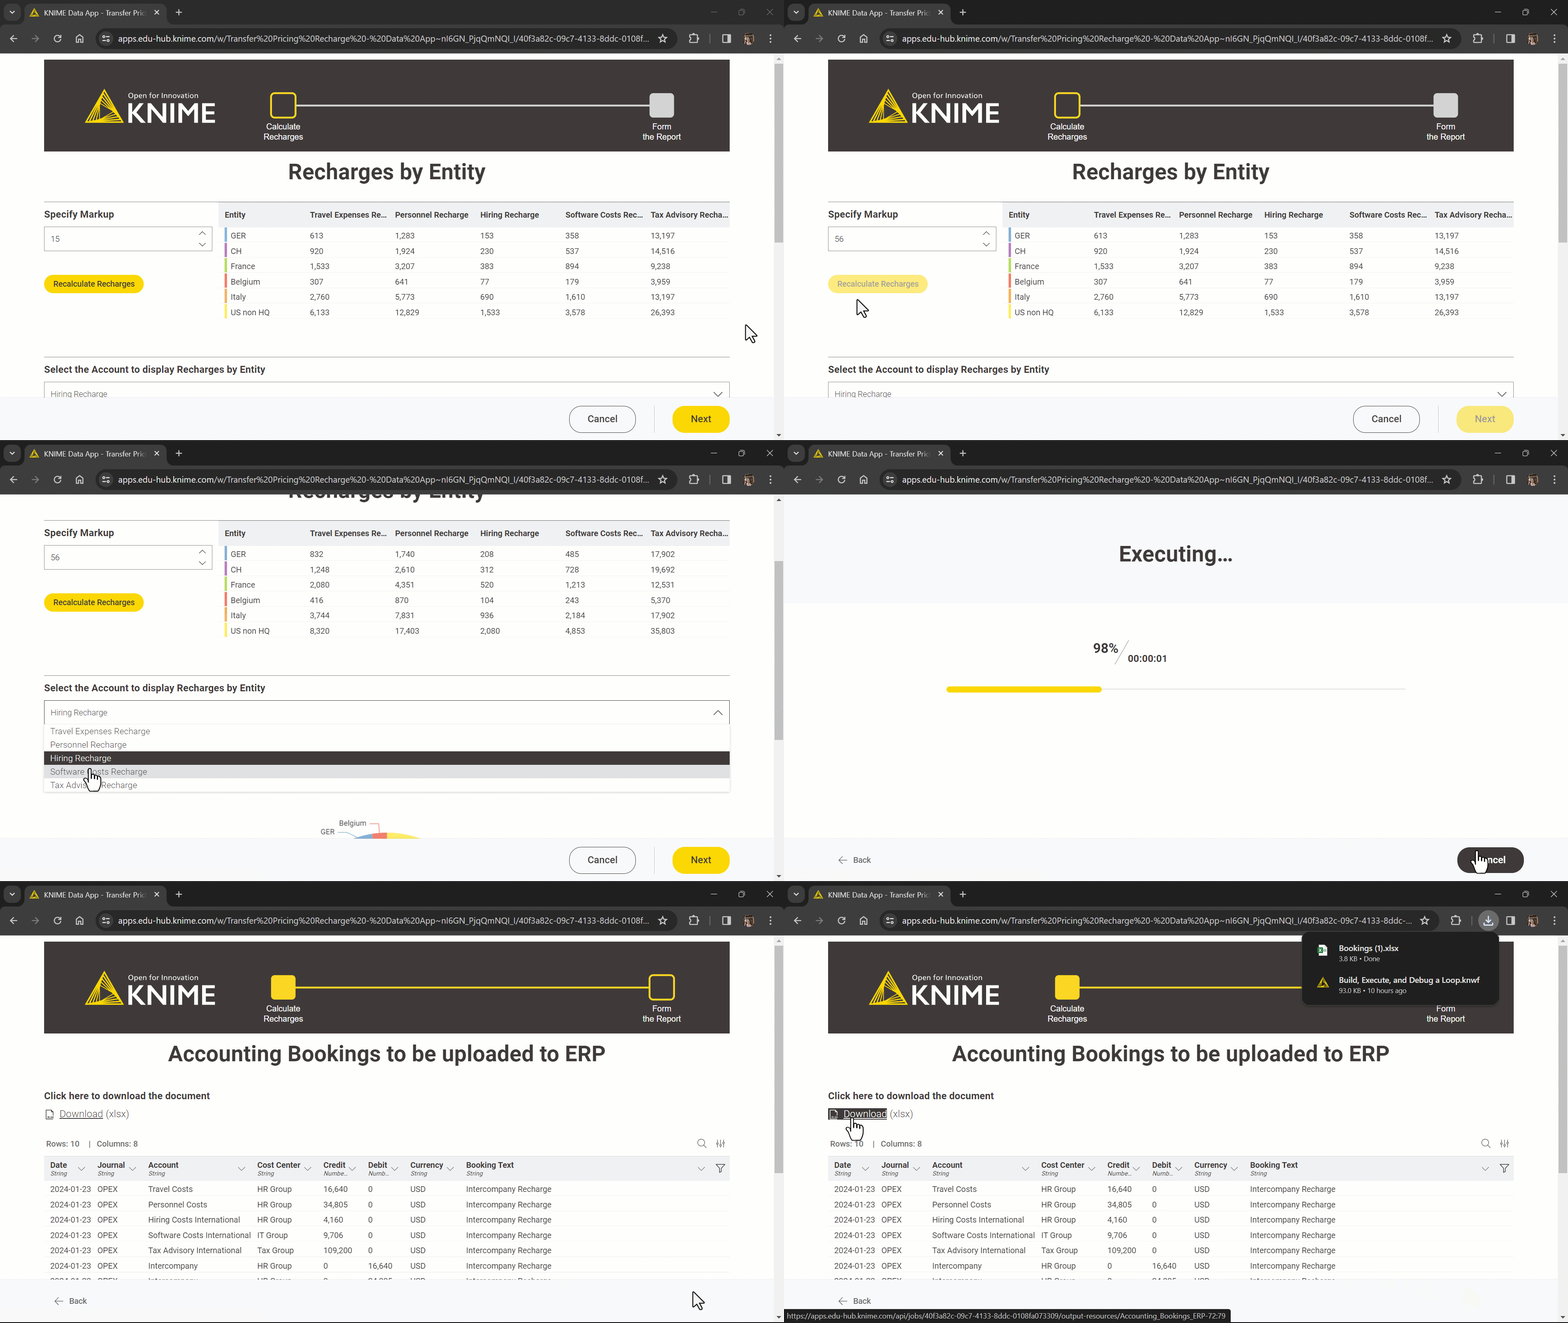
If you then deploy this DataApp on the KNIME Business Hub, these two components, interactive dashboards, will be two pages of the Data App, allowing users to first preview the results based on the input markup and, then, switch to the next page which will create the table of the Accounting Bookings prepared for upload to ERP and allow them to directly download the resulting table.
The data app workflow is available and free to download from the KNIME Community Hub here. This workflow has the same structure as its static versions. However, here, allow more interactivity.
The results: Shareable data app for price transfer recharge
Now, let’s deploy these two data apps on KNIME Business Hub and see how they will look for an end user. Note: Learn how to deploy a data app to KNIME Business Hub with this video.
In the gif below, we show how the data app works. The two pages correspond to the two components we created in KNIME Analytics Platform.
3 key benefits of the KNIME solution
- The intuitive low-code environment enables non-tech savvy users to easily update calculation variables, recalculate, and receive the bookings to be performed in the ERP.
- The dynamic data app allows the user to perform operations via a user-friendly interface; more plots and charts could also be added to provide an even more robust and comprehensive view.
- The solution is easily connected to a REST API or DB by replacing the Excel reader node.
KNIME for Finance
KNIME Analytics Platform is an open-source free low code platform that opens up access to advanced analytics techniques to anyone who wants to make sense of data. Thanks to its visual and intuitive user interface, implementing solutions does not require coding expertise.
Explore the Finance, Accounting, and Audit space on KNIME Community Hub for more low-code/no-code examples.
