The analysis of a company’s carbon emissions is the “E” in Environmental, Social, and Governance (ESG) reporting. By measuring and tracking our carbon footprint we increase transparency, identify what we can improve, and track our emissions over time.
Transparency in emissions calculation is key. The data that is needed to calculate carbon emissions is collected from multiple sources, cleaned, calculated, and converted into the carbon footprint. This complex process has to be transparent in order to understand the emissions impact and enable external auditors to see how the carbon footprint is calculated.
KNIME, as a low-code data science tool, is conducive to transparent emissions calculation. In the low-code environment, the entire process is self-documenting, meaning anyone can look at it and literally see the calculations the data has gone through. Every single piece of data can be tracked and verified back to its source to reveal precisely how the carbon footprint was calculated.
This article describes the key aspects of calculating emissions with KNIME. We will dive deeper into the technical details of the implementation in more detail in a follow-up article.
An carbon emissions inspector for ESG reporting
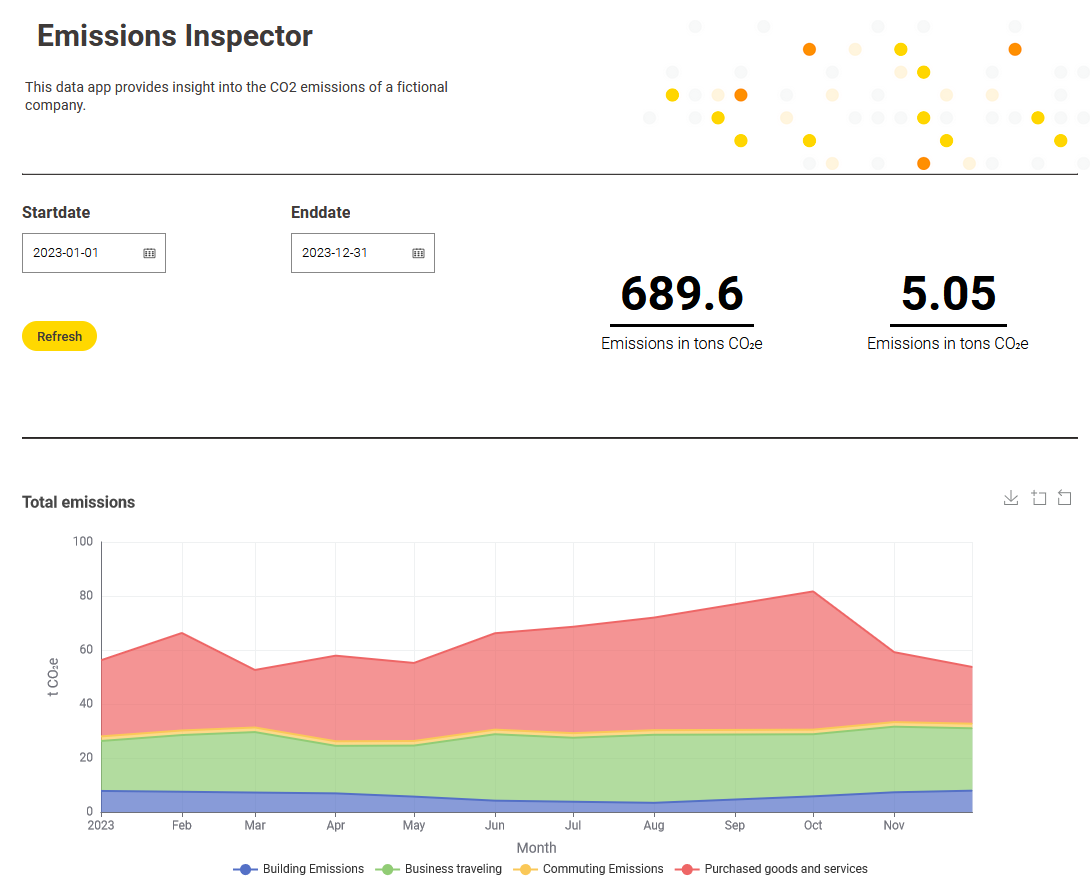
Our Carbon Emissions Inspector monitors emissions from business travel, commutes, office buildings, and purchased goods and services. It’s a shareable data app that’s updated daily with current data. It was developed using the Corporate Sustainability Reporting Directive (CSRD) as a guideline.
It meets six criteria, which we identified as essential for a sustainable solution:
- Transparent: External auditors need to see “how” we calculate our carbon footprint.
- Maintainable: Ensure the solution is easily repaired, improved or adjusted in future.
- Reusable: Provide a blueprint for other companies to download and use.
- Scalable: Ability to accommodate future changes e.g. new scope sub-categories, and growing data volumes
- Analytical depth & breadth: Sophisticated data handling capabilities to cope efficiently with the large volumes of data
- Accessible: Multi-discipline teams need to be able to collaborate; analysis insights need to be easily accessible throughout the company to help us achieve our goal to reduce CO2.
Here are notes on the challenges we experienced, which other organizations are likely to face, and how we overcame them to build a solution that gives us a:
- Friendly interactive dashboard that can be shared as a browser-based data app
- Unified view of CO2 emissions live from different offices
- Transparent and maintainable solution: underlying workflow = low-code + self-documenting

Challenge one: Lack of guidance on reporting standards
The EU provides clear guidance on what companies must report, but in some cases not how. We sought advice from an expert on which reporting standard to use. In consultation with Prof. Erdal Yalcin from the University of Applied Sciences in Constance, we chose the most used and common reporting standard for greenhouse gas emissions, the Greenhouse Gas Protocol.
The Greenhouse Gas Protocol (GHGP) provides a standard to measure, manage, and report greenhouse gas emissions. Greenhouse gases are classified into three main emission categories, which are referred to as scopes.
- Scope 1 covers direct emissions from sources the company owns or controls like the generation of electricity, heat, or steam.
- Scope 2 covers emissions from purchased electricity, heat, cold or steam.
- Scope 3 is the most challenging category because it covers indirect emissions produced in upstream or downstream activities in the value chain. This includes e.g. purchased goods and services, business travel or commuting.
Each scope in turn consists of sub-categories. This classification is also required from the EU and you have to identify which sub-categories apply to your company.
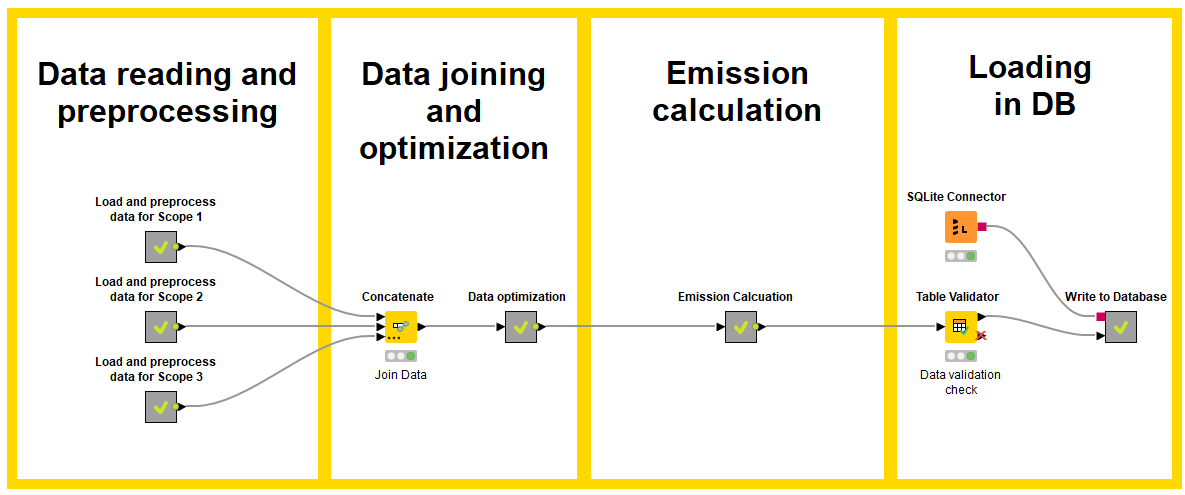
Here at KNIME, we identified “heat” (Scope 1), “purchased electricity” (Scope 2), “purchased goods and services” (Scope 3), “business travel” (Scope 3) and “employee commutes” (Scope 3) as the emission types to include in the Carbon Emissions Inspector. You can see them reflected in the KNIME workflow below.

Challenge two: Complex data collection
Accurate data collection is essential for reliable carbon emissions calculation.
KNIME made it easy to access all relevant data sources and bring the data together. KNIME has 300+ connectors to data sources and community-driven APIs.
Here, you can see various types of connectors we used to connect to the data inputs like Google Sheets Connectors to access the emission factors.

Challenge three: Error-prone data manipulation
The data from all the various information sources has to be cleaned to make it comparable and reliable. This is a huge task, where you dive deep into (lots of) data to ensure consistency and accuracy.
Powerful file handling capabilities ensure that all ETL processes are scalable, repeatable, and reusable. In KNIME, you write your process once and can reuse it again and again on your data, or wrap it into a component to plug in to any solution. Your ETL clean-up operation or standardized logging process, wrapped as a component, can be shared within your team and reused, leaving no room for the type of errors that slip into manual processes.
Challenge four: Transparent emissions calculation
Emission factors are the key to calculating greenhouse gas emissions. They define the ratio at which a particular activity emits greenhouse gases (GHG) into the atmosphere.
There are currently no EU guidelines or standards for the usage of emission factors, which is surprising as the emission factors have a major influence on the result of the calculation.
Together with Prof. Yalcin, we defined a suitable set of emission factors that represents the emissions from our business trips, commutes, purchased goods, etc., as realistically as possible. Especially indirect emissions factors are crucial as they represent emissions which arise in up- or downstream activities of the value chain which the company can't control. Notably, these factors have been calculated by Professor Yalcin, employing data from official registries and based on internationally recognized quantitative methods.

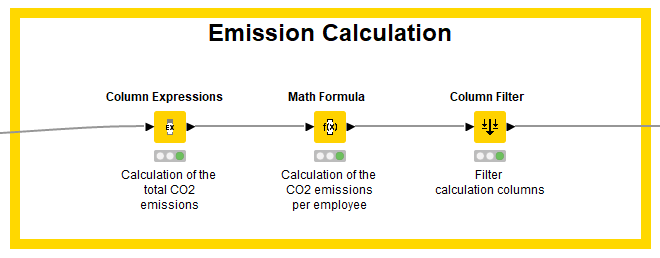
The emission factors are saved inside the KNIME solution and applied to the data. As you can see in the graph, each step of the calculation can be traced to see how the conversion is calculated. External auditors can review the intuitive, low-code solution and see how the data has been transformed. You can also export a summary of the solution, which traces all data points and transformations for audit review.
Challenge five: Dissemination of results
Reducing carbon emissions is a task for the entire company: Getting everyone on board is crucial to success. But getting that analytical insight out to your teams is the last mile problem of analytics.
Our Carbon Emissions Inspector tracks the main KPIs in an interactive dashboard, shared as a browser-based data app. The preprocessing is done in a separate workflow that powers our Carbon Emissions Inspector. With KNIME Business Hub it is literally a matter of clicks to deploy the workflow. It’s scheduled to run every 24 hours and provide fresh data for CO2 tracking. Any employee can access the data app, choose a time period they’re interested in, and quickly get up-to-date information. We can now quickly identify hotspots, formulate targets and measures to reduce them.
Explore the Carbon Emissions Inspector
At KNIME our internal Data&Analytics Team takes care of all data analysis of our own data and of course does all of this with KNIME. The Carbon Emissions Inspector workflow, described in this article was developed by the team. Explore the workflow on KNIME Community Hub. It’s free to download and adapt to your ESG reporting requirements.
