Definition of Customer Segments
Customer segmentation has undoubtedly been one of the most implemented applications in data analytics since the birth of customer intelligence and CRM data.
The concept is simple. Group your customers together based on some criteria, such as revenue creation, loyalty, demographics, buying behavior, or any combination of these criteria, and more.
The group (or segment) can be defined in many ways, depending on the data scientist’s degree of expertise and domain knowledge.
- Grouping by rules. Somebody in the company already knows how the system works and how the customers should be grouped together with respect to a given task, e.g. a campaign. A Rule Engine node would suffice to implement this set of experience-based rules. This approach is highly interpretable, but not very portable to new analysis. In the presence of a new goal, new knowledge, or new data the whole rule system needs to be redesigned.
- Grouping as binning. Sometimes the goal is clear and not negotiable. One of the many features describing our customers is selected as the representative one, be it revenues, loyalty, demographics, or anything else. In this case, the operation of segmenting the customers in groups is reduced to a pure binning operation. Here customer segments are built along one or more attributes by means of bins. This task can be implemented easily, using one of the many binner nodes available in KNIME Analytics Platform.
- Grouping with zero knowledge. We can assume that the data scientist frequently does not know enough of the business at hand to build his own customer segmentation rules. In this case, if no business analyst is around to help, he should resolve to a plain blind clustering procedure. The after-work for the cluster interpretation belongs to a business analyst, who is (or should be) the domain expert.
With the set goal of making this workflow suitable for a number of different use cases, we chose the third option.
There are many clustering procedures and KNIME Analytics Platform makes them available in the Node Repository panel, in the category Analytics/Mining/Clustering, e.g. k-Means, nearest neighbors, DBSCAN, hierarchical clustering, SOTA, etc … We went for the most commonly used: the k-Means algorithm.
Basic Workflow for Customer Segmentation
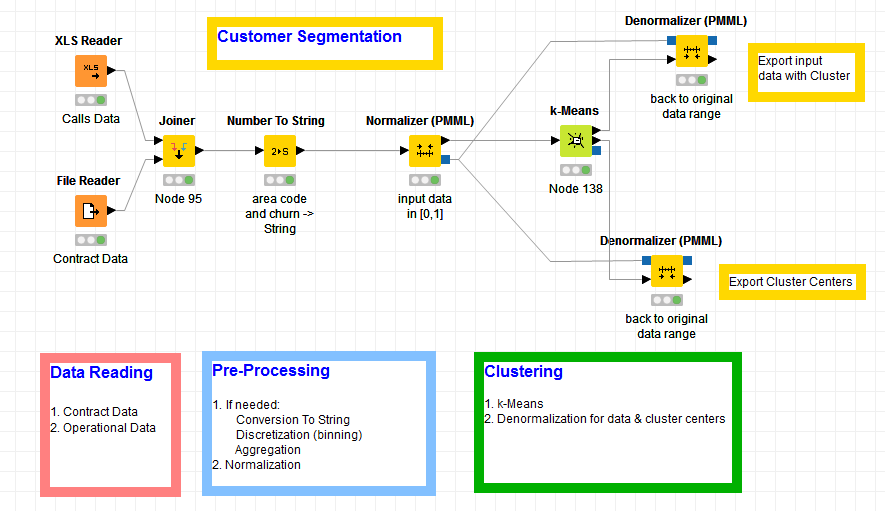
Thus, the basic workflow for customer segmentation consists of only 3 steps: data reading, data pre-processing, and k-Means clustering (Figure 1). The clustering procedure - in this case the k-Means algorithm - and its associated normalization/denormalization transformations represent the segmentation engine that is the intelligent part of this workflow.
Figure 1. Basic Workflow for Customer Segmentation using Clustering

(click on the image to see it in full size)
If knowledge becomes available and we decide to change segmentation strategy, clustering can be replaced by a Rule Engine node (grouping by rules) or a Binner node (grouping as binning)
Refining Customer Segments with Business Knowledge
A desirable improvement of this segmentation strategy could be the involvement of business analysts in the process. Modern business analysts have precious knowledge of the data acquisition process and of the business case. Allowing them to interact with the results of the segmentation is frequently beneficial.
The idea thus is to guide modern business analysts through all phases of the analysis from a web browser as opposed to from within the workflow. In the second part of this project, a web-based visualization wizard is created, by strategically placing a number of Quickform and Javascript nodes within the workflow.
Indeed, on the KNIME WebPortal, workflow execution hops from a Quickform or Javascript node to the next, producing a web-based GUI wizard. It is thus possible to enable full guidance to the analysis on the web browser: for example, step 1 select appropriate values, step 2 inspect plot and readjust selected values, and so on.
For each step, it is possible to design the GUI by placing multiple UI items on a web page layout, such as dropdown menus, radio buttons, interactive plots, and more. UI components are generated by Quickform and Javascript nodes and form a web page if placed inside a wrapped node. The layout is controlled through a JSON-like matrix.
The first step of the web-based wizard for customer segmentation requires the number of segments and the data columns to be used. Segments (clusters) are then created in the background.
In the second step, a summary of all segments is displayed in a scatter plot and proposed to business analysts for inspection. The scatter plot is interactive and the business analyst can decide whether to change the coordinates for a new inspection perspective or remove outliers. However, already with only 4 clusters, the scatter plot becomes hard to interpret.
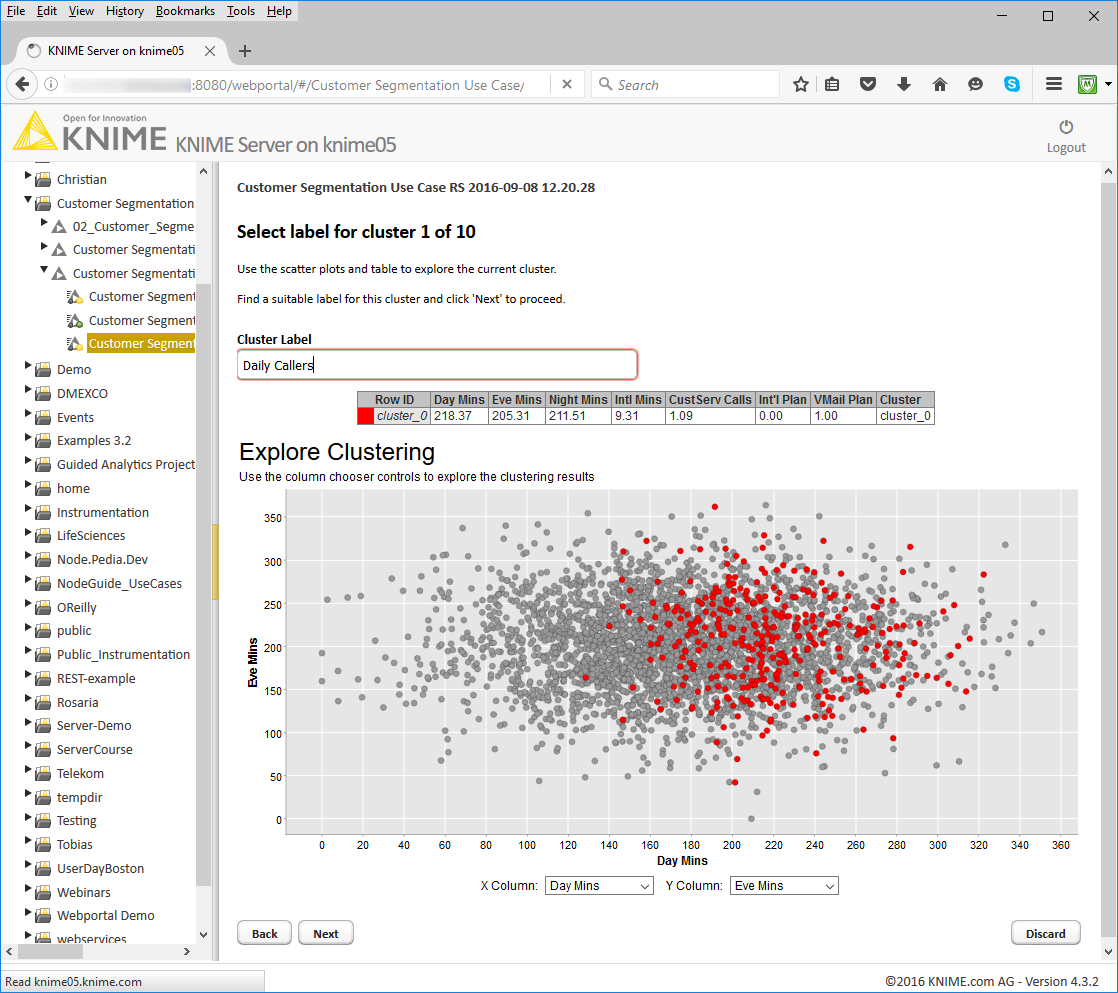
So, in the next steps the segments get displayed one by one. The data are taken through a loop where at each iteration the data points for one cluster are displayed in color against all other points displayed in gray (Figure 2).
Figure 2. Accessing the workflow from a web browser through the KNIME Web Portal. This is the page where cluster 0 (segment 0) is displayed and an option to label it is offered

(click on the image to see it in full size)
At each iteration, the wizard web page reports the scatter plot with the cluster, the table with the cluster centers, and a textbox to enter free text. The textbox allows the business analysts to appropriately label or annotate the segment under scrutiny.
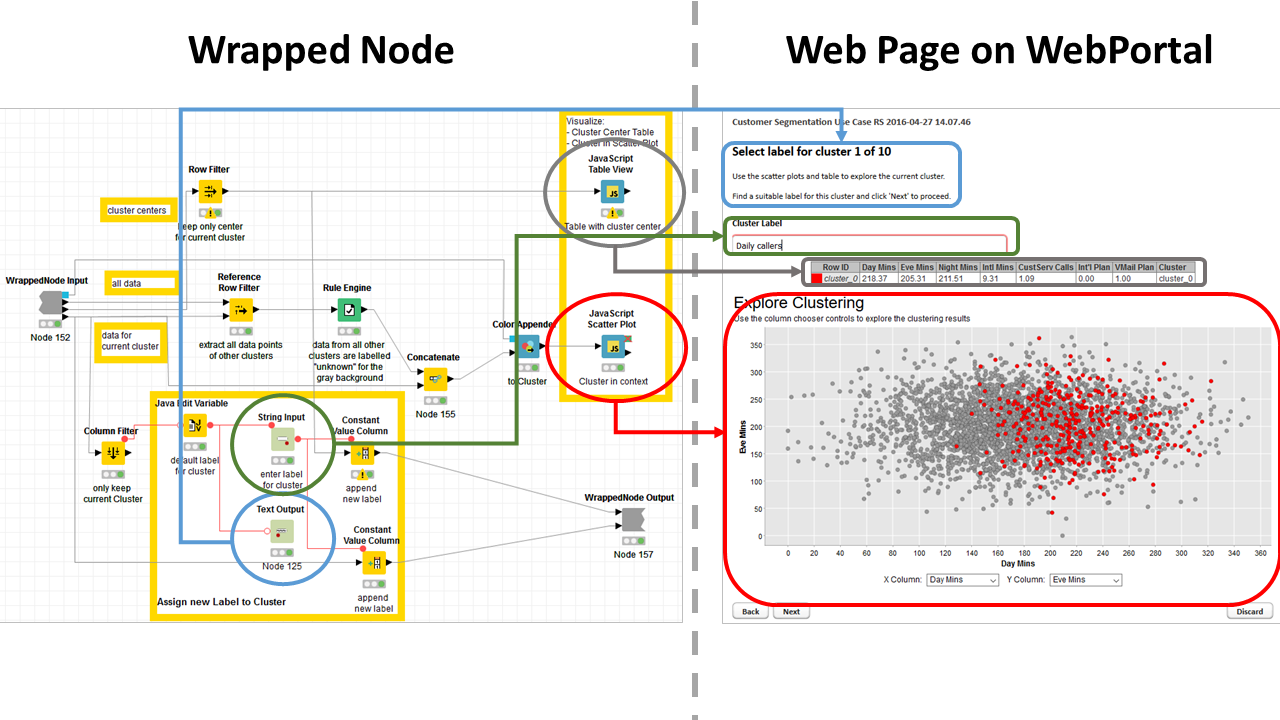
Figure 3. Quickform and Javascript based nodes in a wrapped node on the right produce the web page on the left on KNIME WebPortal

(click on the image to see it in full size)
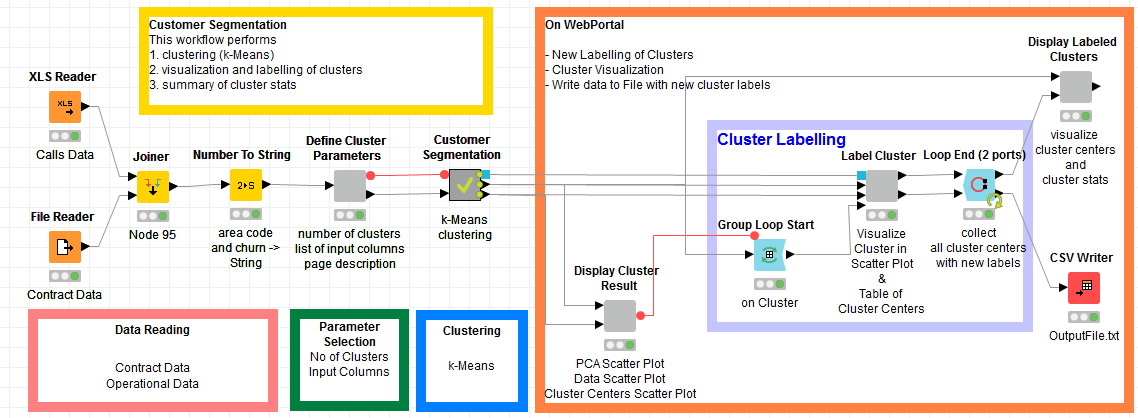
The complete workflow is shown in figure 4, with the segmentation part in figure 1 on the left and the visualization-interaction loop on the right. The content of the wrapped node named “Label Cluster” and its corresponding web page are shown in figure 3.
Figure 4. Final Workflow derived from the basic workflow for customer segmentation in figure 1. The loop on the right goes through all clusters one by one. The wrapped node, named “Label Cluster” produces the web page in figure 3. The whole sequence allows the business analysts to refine and label the customer segments one by one

(click on the image to see it in full size)
This is just the first step towards web-based analytics, bringing together the machine learning background of the data analyst and the business knowledge of the modern business analyst.
The whole project is described in detail in our most recent whitepaper, “Customer Segmentation Comfortably from a Web Browser. Combining Data Science and Business Expertise”.
The two workflows described in this post can be downloaded from the KNIME Hub.
* The link will open the workflow directly in KNIME Analytics Platform (requirements: Windows; KNIME Analytics Platform must be installed with the Installer version 3.2.0 or higher)
