
Triathlon is a thrilling sport that challenges athletes across swimming, biking, and running – since 2000 even in the Summer Olympics. Since it combines three disciplines, not only the competition itself but also the training regimes are very demanding for the athletes.
In this post, I will explore whether your chances of making it to the podium are influenced by factors like body mass index (BMI), age, and performance in each discipline. And I’m going to use the free low-code KNIME Analytics Platform to do it.
I will focus on both Olympic and Ironman 70.3 events, with Olympic distances being 1.5 km swim, 40 km bike, and 10 km run (totaling 51.5 km), and Ironman 70.3 distances being 1.9 km swim, 90 km bike, and 21.1 km run (totaling 113 km).
Building on previous researches, such as the study of Roberto Cejuela (2013) that emphasized the importance of transition times between disciplines and the paper of Caio Victor Sousa (2021) on the best disciplines for predicting overall performance, I would like to introduces a new perspective by incorporating BMI data including height and weight, which have often been overlooked. Moreover, I will compare performance predictors across Ironman and Olympic triathlons, focusing on groups of athletes clustered by performance ranges rather than individual results.
This article will address the following key questions:
- What is the distribution of triathletes’ BMI and age?
- Do demographics and BMI influence the chances of winning Olympic triathlon medals?
- Which discipline is most crucial for overall performance?
All workflows used in this article are available for free download from the KNIME Community Hub under the Sports Analytics space.
Is your demographic information and body mass index similar to Olympic triathletes?
To optimize your chances of winning a triathlon, it's essential to understand the performance tracking and demographics of all athletes, with a particular focus on the medalists. By comparing your own indexes with those of Olympic triathletes, you can gain valuable insights into how to tailor your training.
Data aggregation: Bring together 120 years of Olympic history and World Triathlon performance data
The data that I’ll use combines two sources that provide information on demographics, body mass index, and performance in the Olympic triathlon. The first dataset spans 120 years of Olympic history, providing a comprehensive look at the evolution of the triathlon sport in the Olympics and the demographic information of triathletes.
The second dataset provided by the World Triathlon organization focuses specifically on performance data, offering detailed insights into the performances of triathletes from the 2000 to 2016 Summer Olympics.
To merge these two datasets, I had to tackle several challenges, including standardizing the data type and matching strings since the datasets don’t contain a common, unique identifier for athletes. For more details, you can check out the data aggregation workflow.
Data exploration: Compare your age and BMI with athletes around the world
Analyzing the distribution of all Olympic triathlon participants, focusing on age ranges and BMI for both male and female athletes, will enable you to compare your age and BMI with those of triathletes from around the world.
Lastly, I will use the Geospatial Analytics Extension to create meaningful and visually appealing plots showing the country that has won the most triathlon medals in Olympic history up to 2016 on a world map.
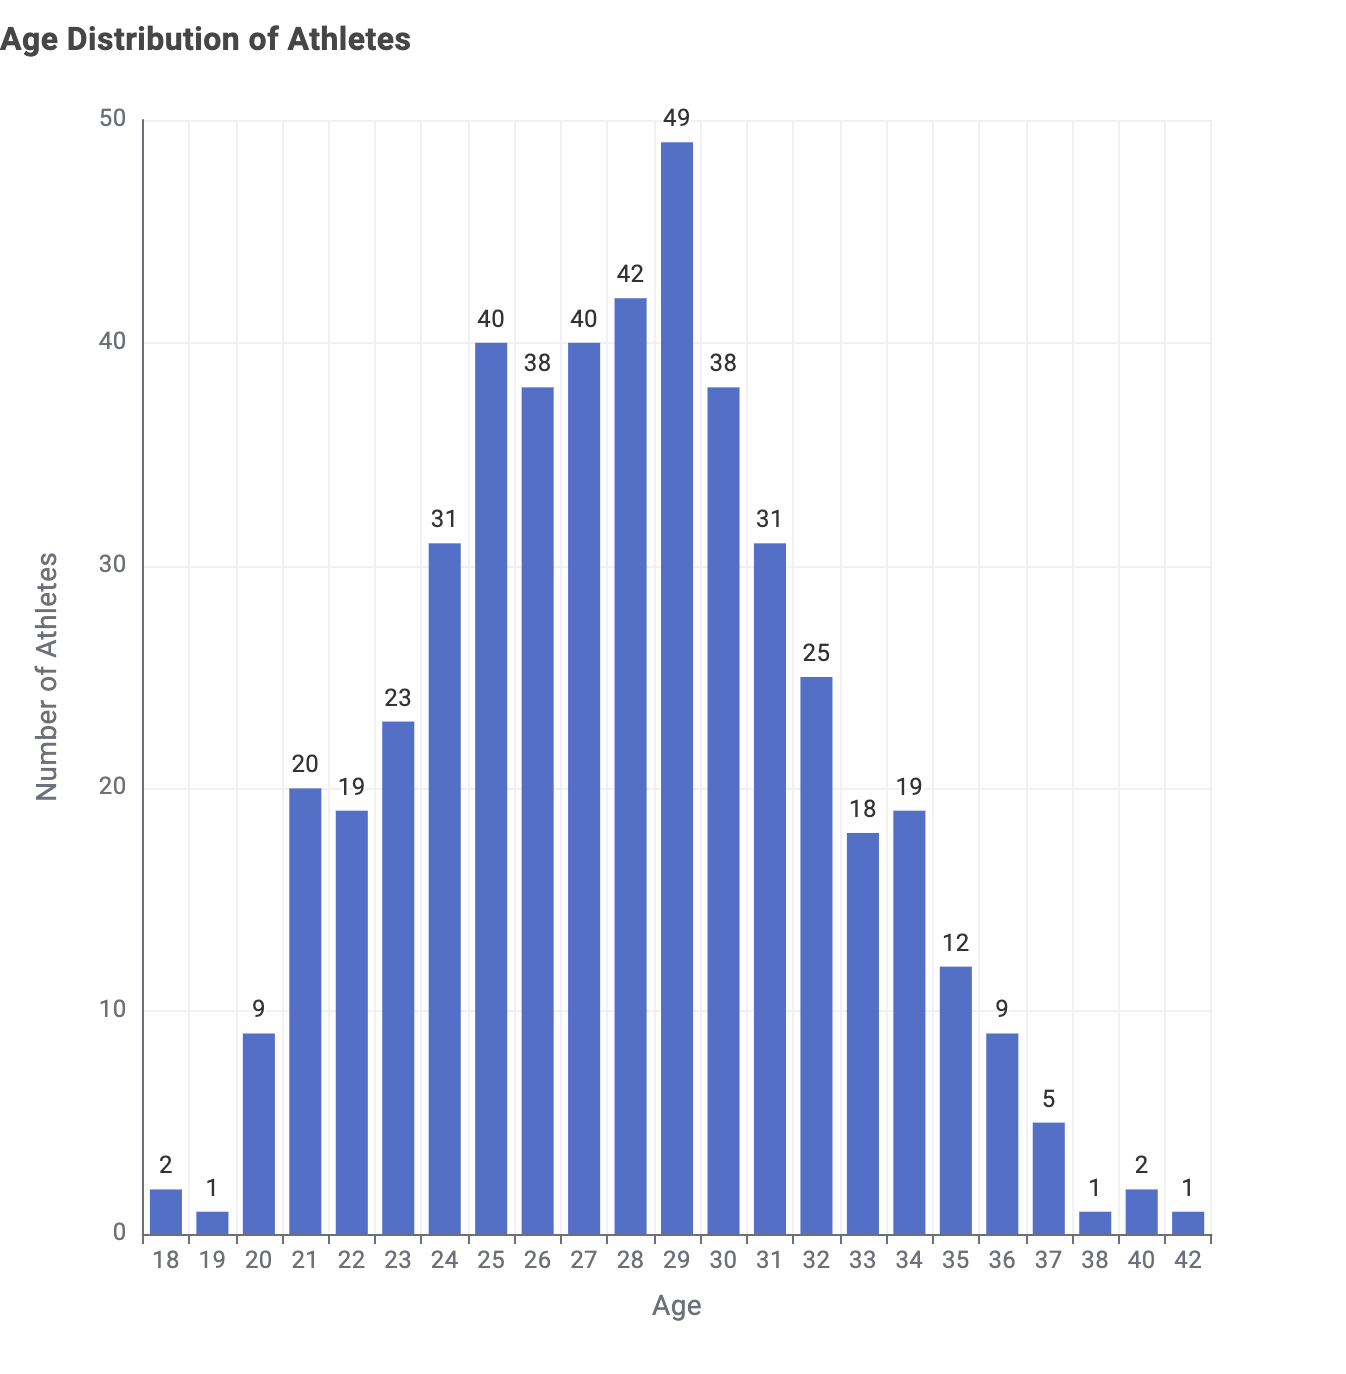
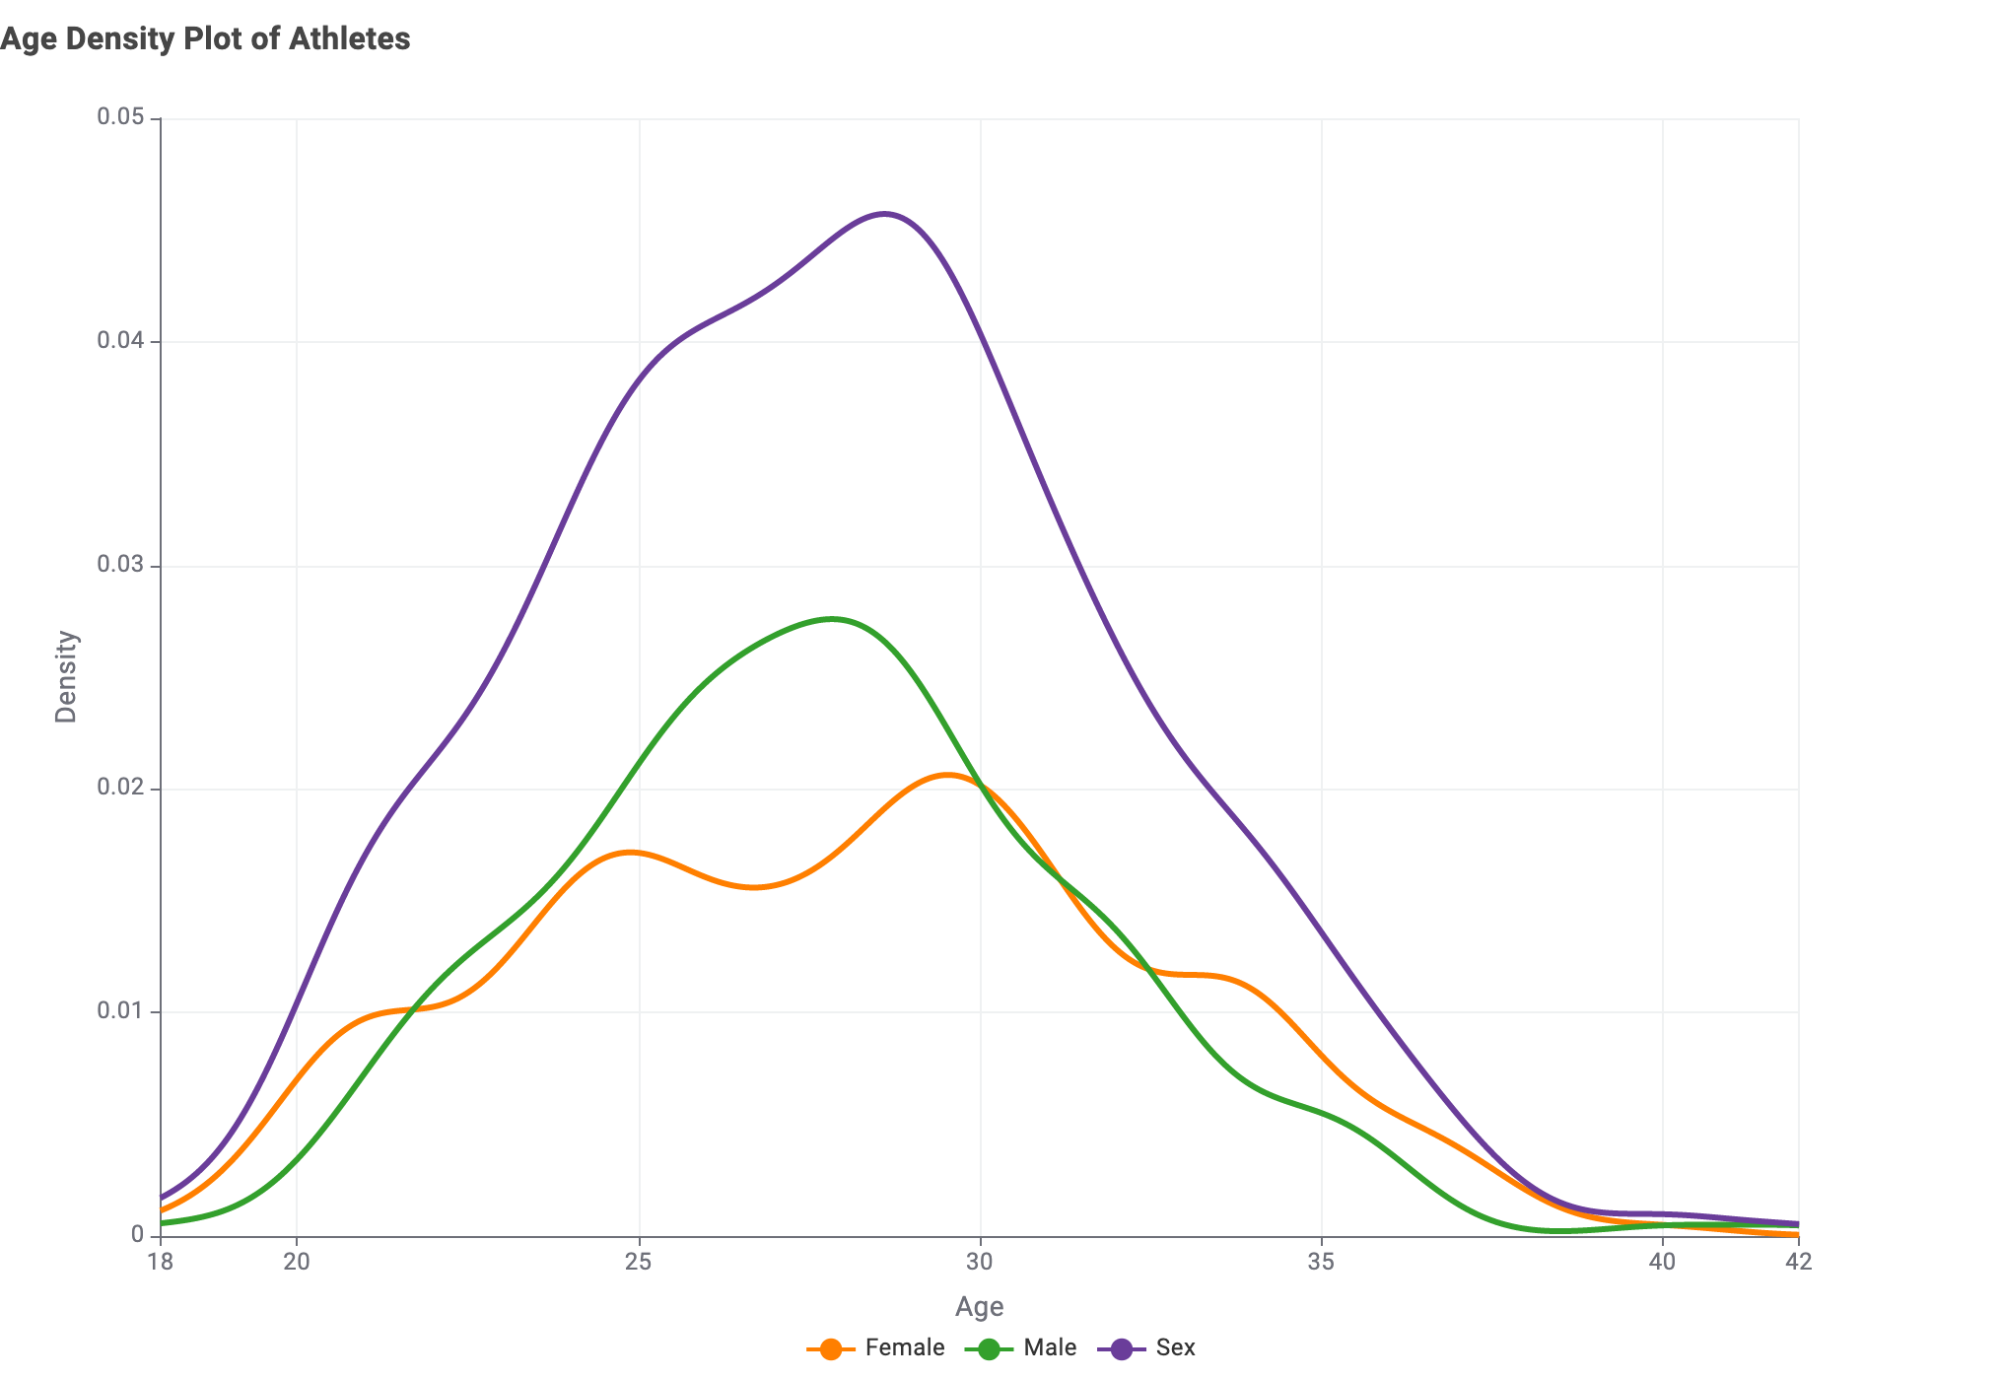
Age distribution of triathlon athletes
The plots below illustrate the age distribution of triathletes. The workflow for the two plots can be found here on KNIME Community Hub.
- Past participants were between 18 and 42 years old, with the most occuring ages being 28 and 29 years. Beyond this, the “Total” and “Male” densities show a positively skewed distribution, indicating a larger proportion of younger athletes compared to older ones.
- For female athletes, the age distribution suggests that fewer individuals are at the extremes of the age range.
- Overall, female athletes are generally older than males, highlighting unique age dynamics between genders.
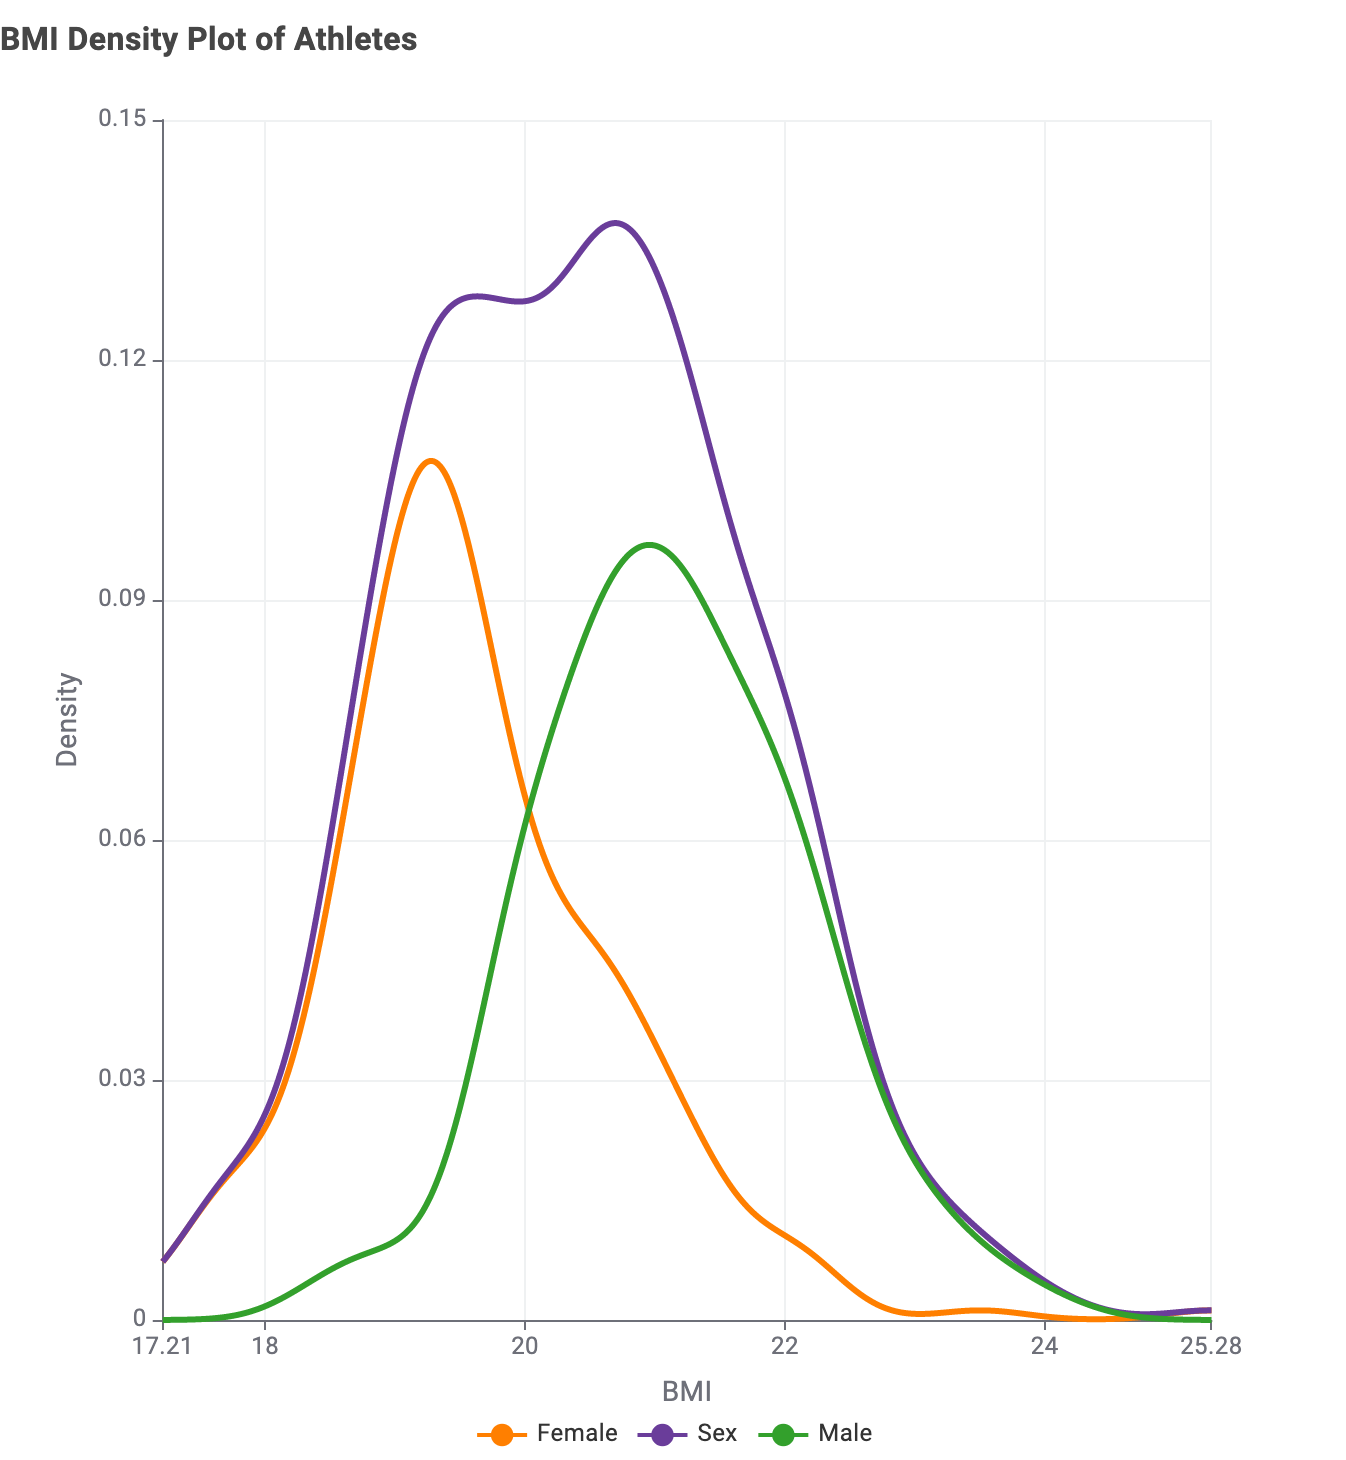
BMI of male and female triathlon athletes
The plot below shows the BMI distribution of triathlon athletes. The workflow for this plot can be found here on KNIME Community Hub.
- The BMI distribution of male athletes looks almost like a normal curve, meaning it’s evenly spread out.
- The BMI distribution for female triathletes is slightly skewed to the left, indicating more variation. On average, female participants have a lower BMI than males.
- About half of the female athletes are classified as underweight (with a BMI less than 18.5) according to Connor B. Weir (2004), while the majority of male athletes fall within the normal weight range (BMI between 18.5 and 24.9).
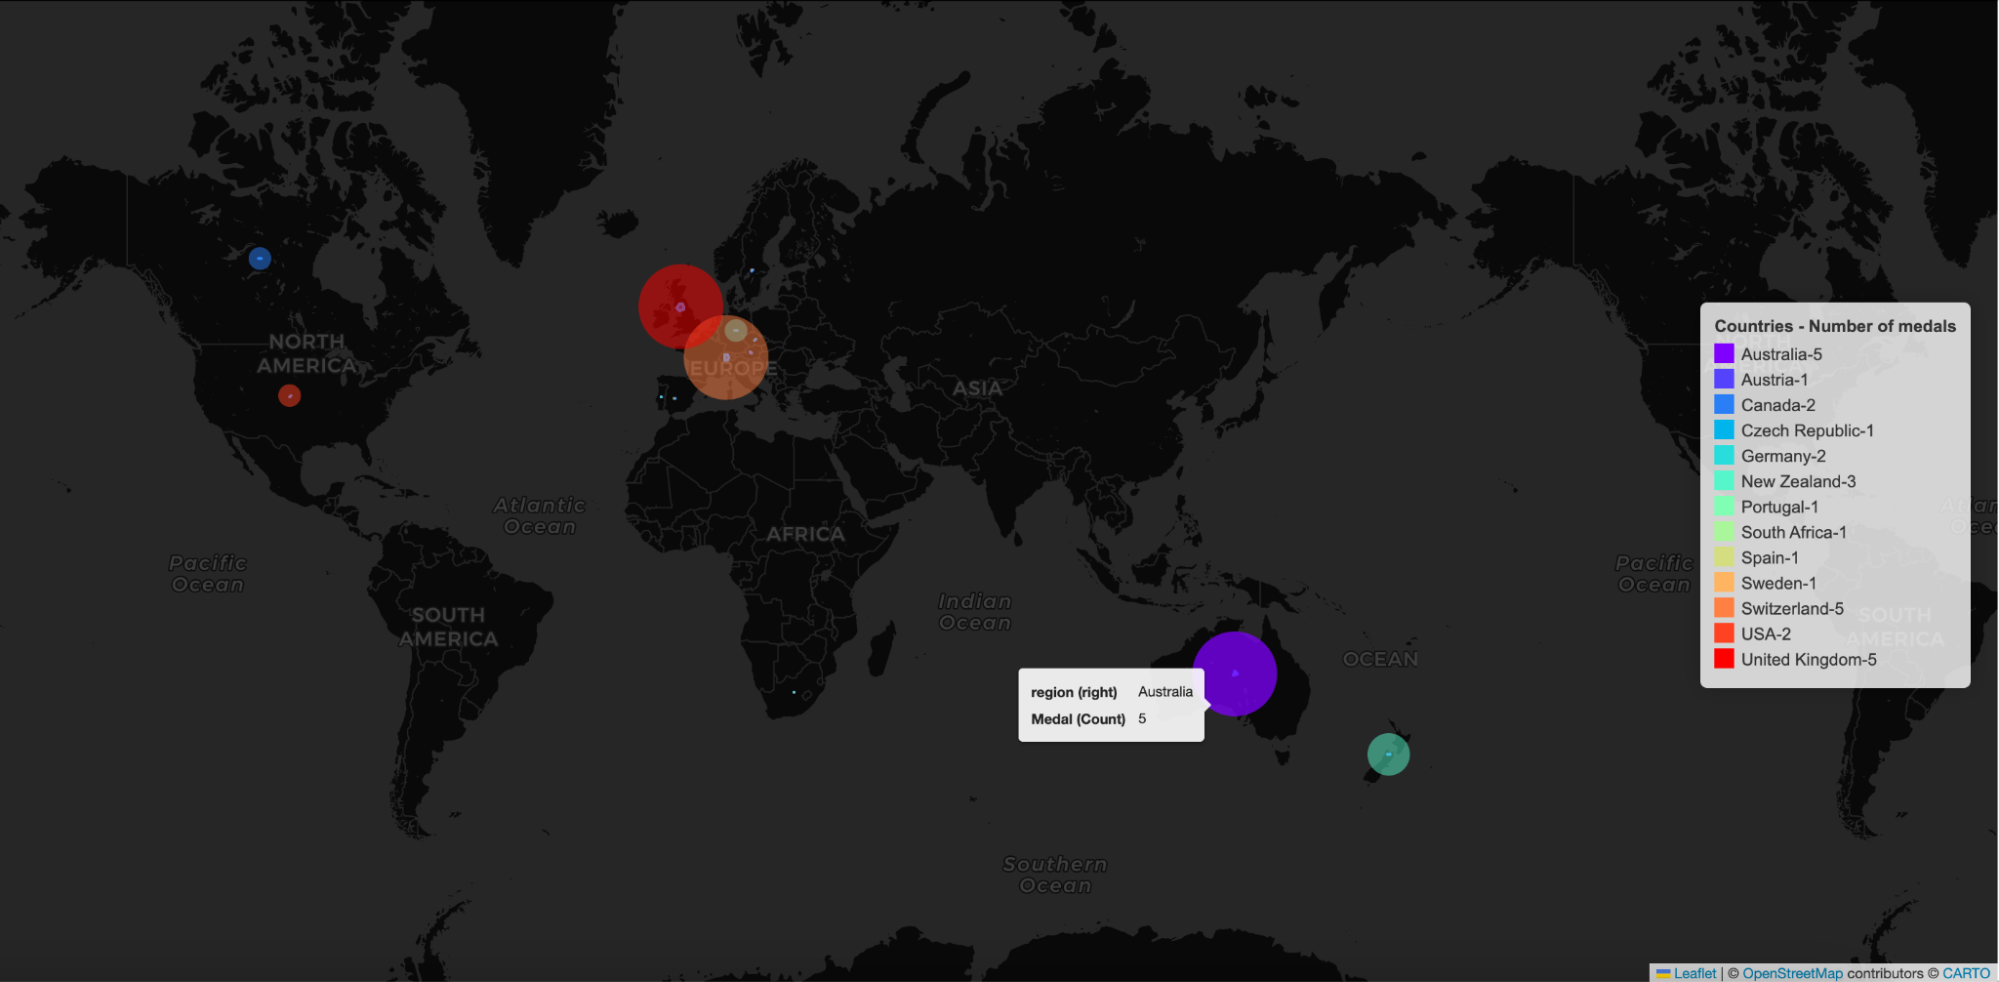
Medalist demographics
The world map of countries of triathlon winners was created using KNIME's Geospatial Extension. You can find the workflow used to create the map here on KNIME Community Hub.
The map shows that:
- According to Olympic history, triathlon is a sport predominantly dominated by European countries and nations within the Pacific region, or by countries with a predominantly Caucasian population.
Do demographic information and BMI affect the likelihood of winning an Olympic triathlon medal?
To find out, I started by training a logistic regression model for the binary classification problem of predicting whether an athlete wins a medal or not. My model considered demographic features and body mass indexes (sex, age, height, weight) alongside performance metrics (swim, T1, bike, T2, run) and the athlete's start number.
After that, I conducted feature selection and ablation experiments to test the impact of demographic variables on performance. However, out of all the data points, only 30 represented athletes won medals.
This imbalance causes the model to predict 'no medal' for almost every instance, resulting in misleadingly high accuracy. Given this, I prioritized models that could improve the F1 score to ensure that our model has a high true positive rate.
You can download the workflow I used for this analysis here from KNIME Community Hub.
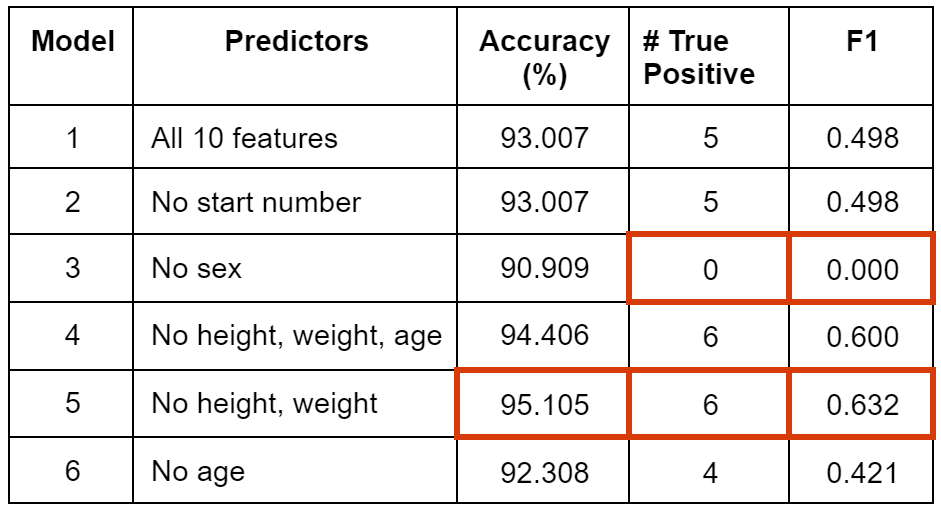
The ablation experiments revealed some interesting patterns in the models that are shown in Table 1.
Most notably:
- “Model 3” had no true positive predictions, meaning it failed to identify any athletes who won medals. The model's lack of success might be due to not including the important feature of sex.
- “Model 4” and “Model 5” showed the best F1 score and identified the highest number of true positive predictions (6 out of 9). This indicates that height, weight, and age are not significant features in predicting medal winners.
- Among the four demographic features considered, sex appears to have the strongest impact on performance, while age shows a slight correlation.
- The start number surprisingly has a small but noticeable effect on the chance of winning a medal.
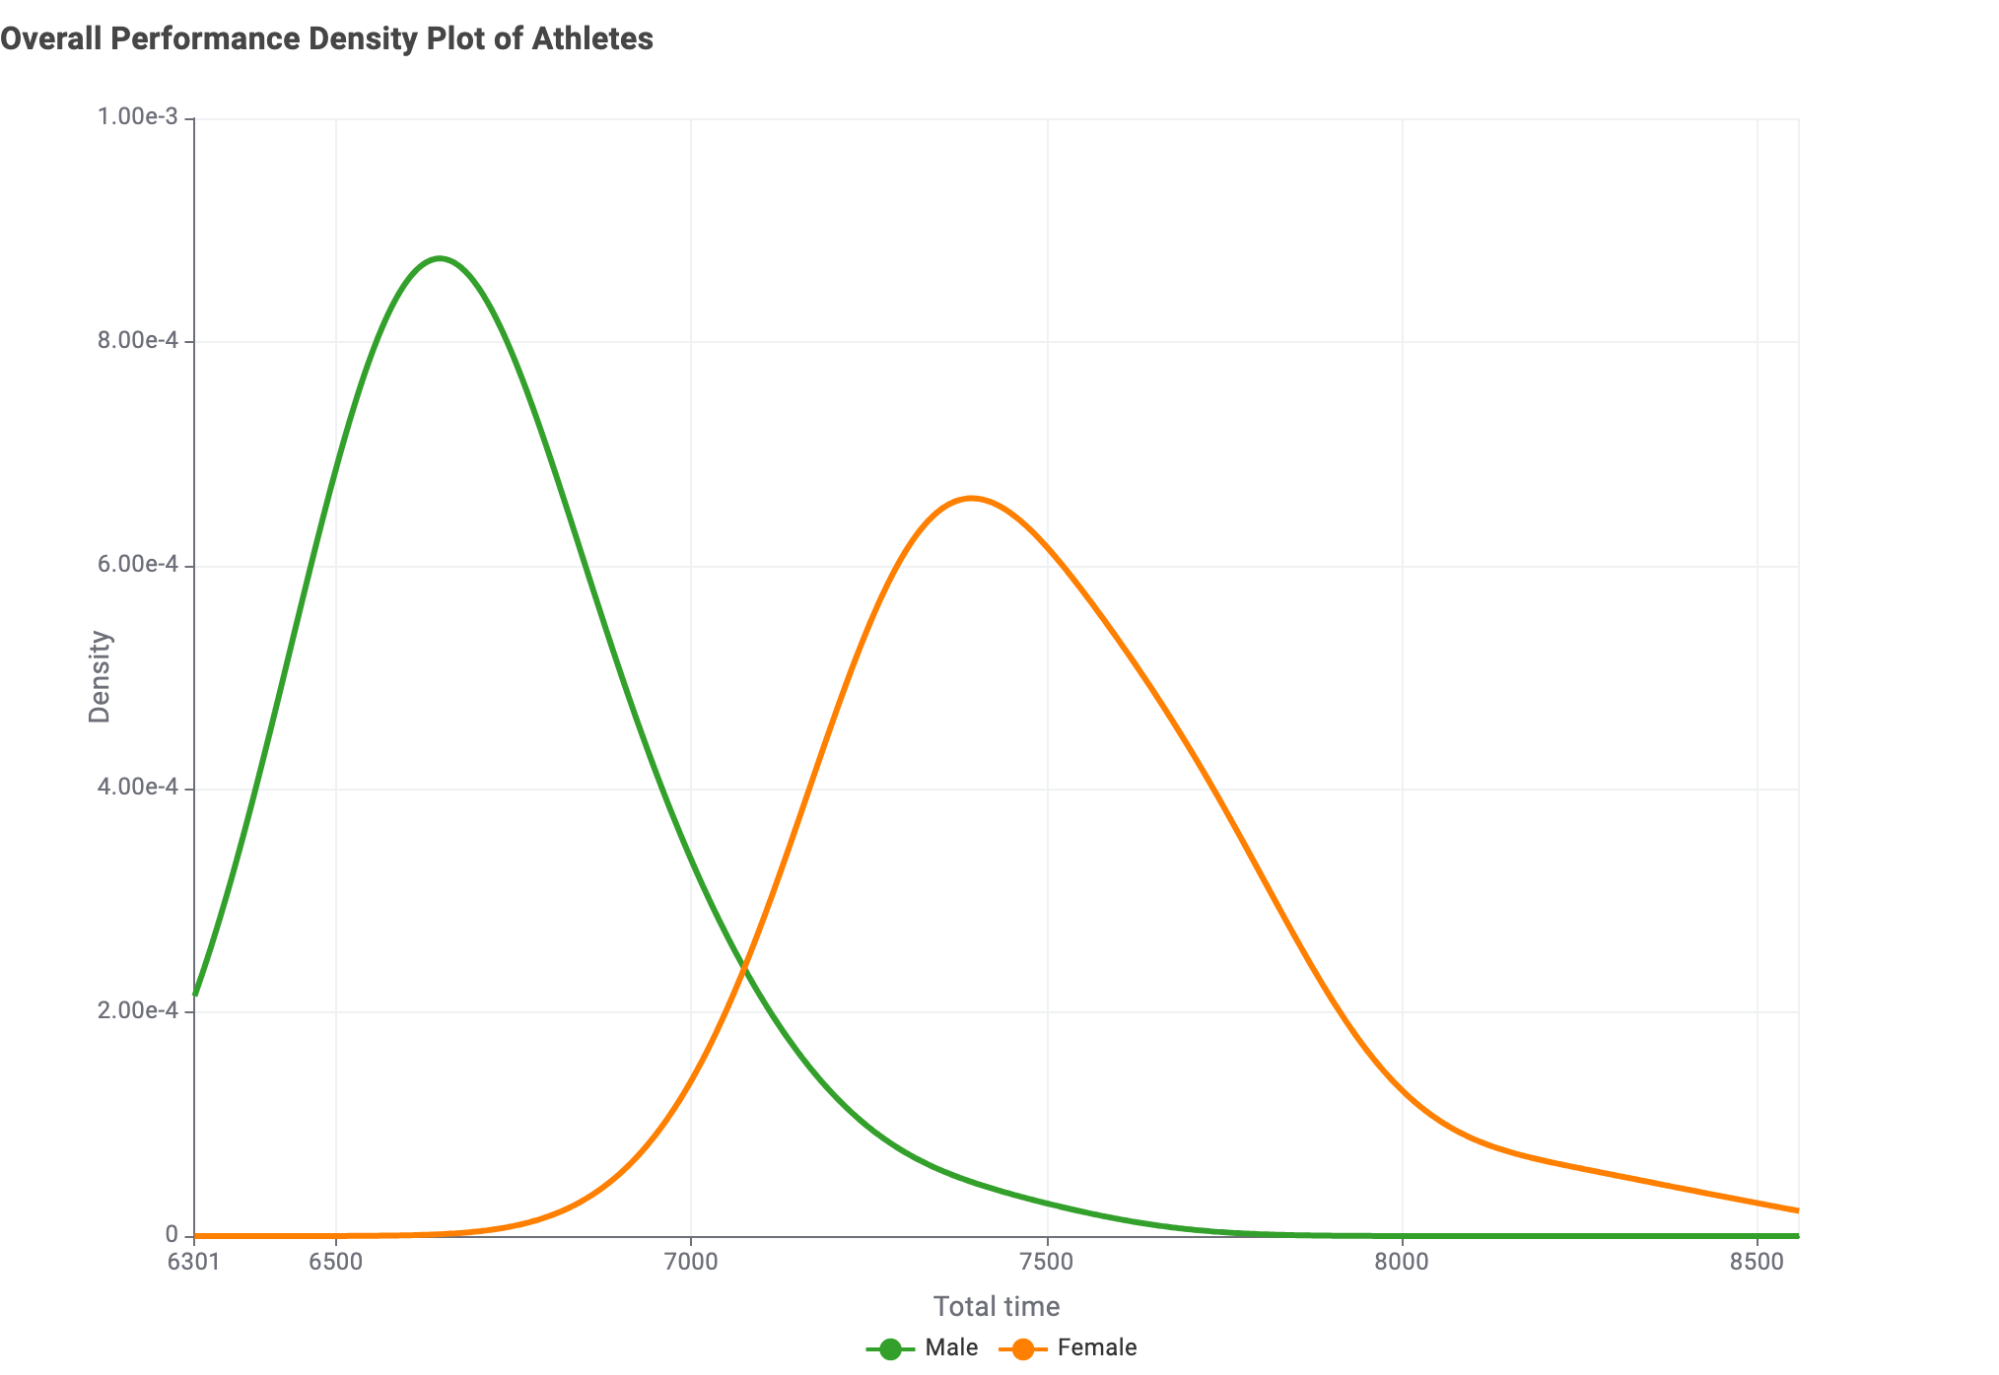
- When plotting the density of overall performance by sex, as shown in the next plot below, it’s clear that the overall performance differs between male and female athletes.
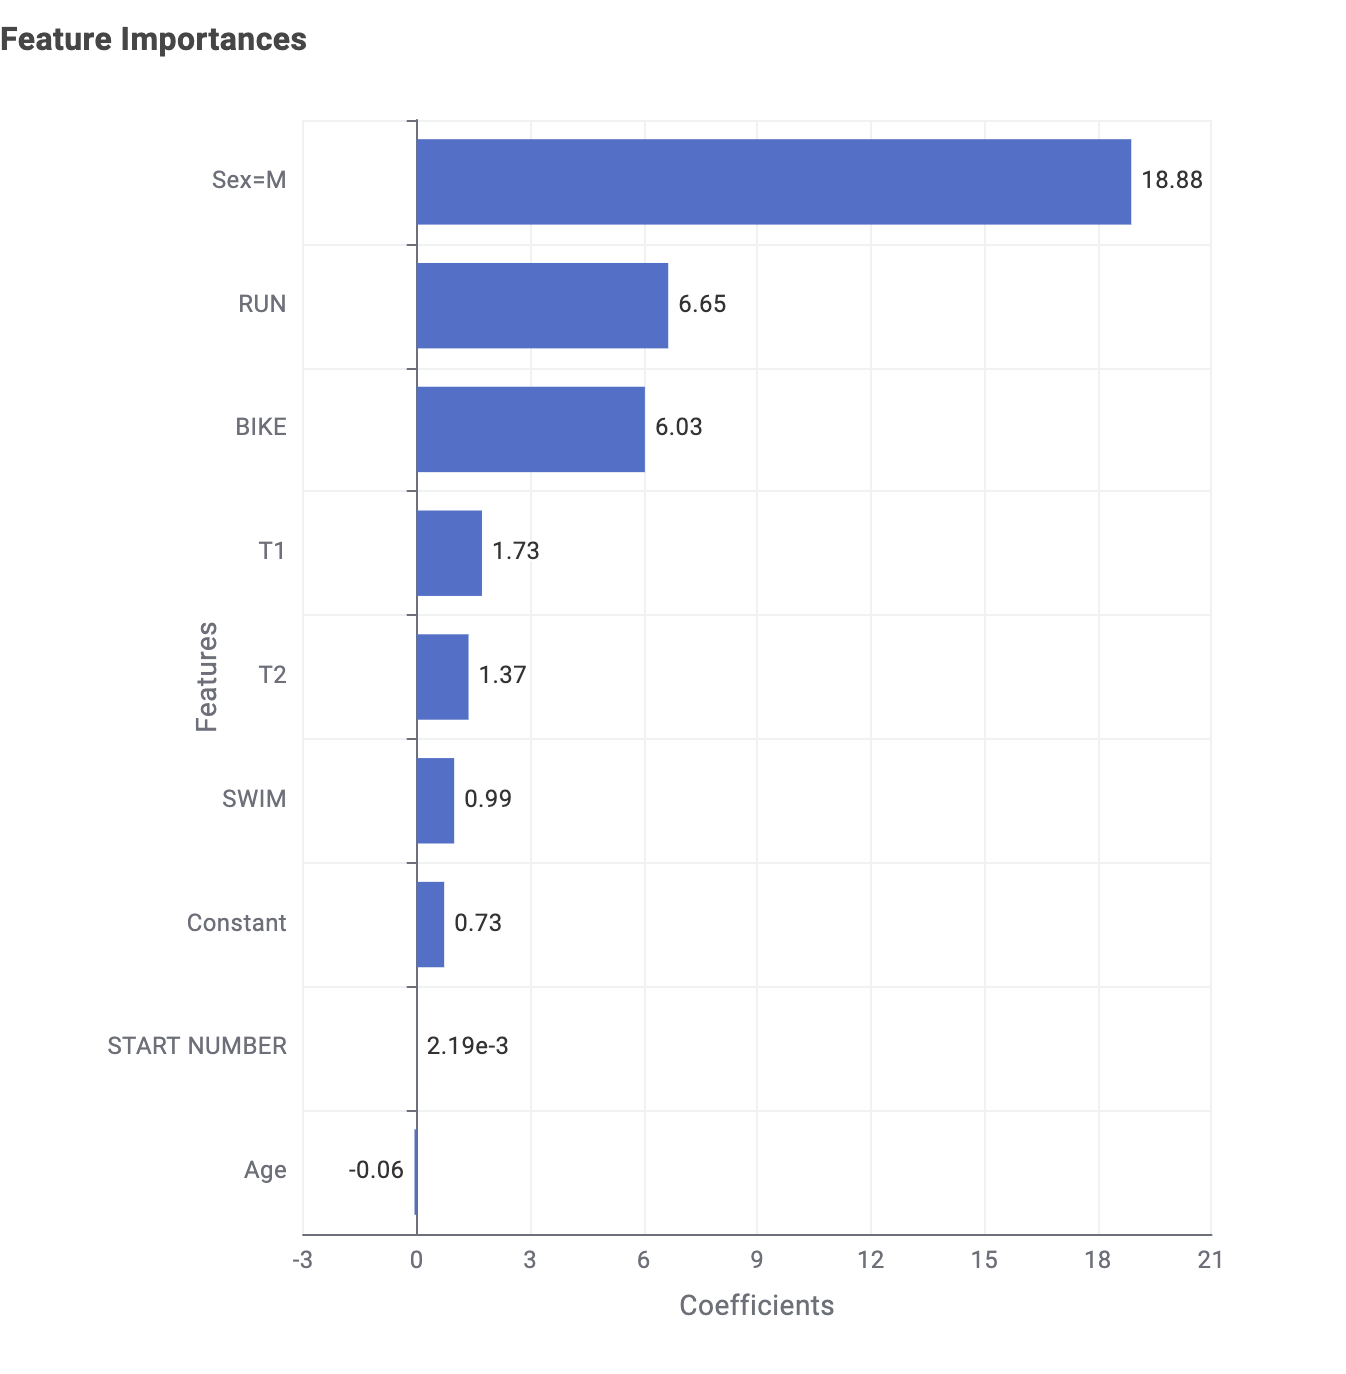
Analyzing the coefficients of “Model 5” as shown in the next plot, below, reveals that:
- Sex is the most crucial variable
- Swim performance is the least important among the disciplines
- Interestingly, the importance of each discipline does not follow the order in a triathlon (swim, bike, run), but rather the reverse (swim, bike, run)
- Similar to many other sports, the final stretch of the race is critical, therefore optimizing the transition time between swimming and biking is slightly more important than other transitions
You can download the workflow I used to analyze feature importance here from the KNIME Community Hub.
Should athletes use the same training strategies for an Olympic triathlon and an Ironman?
The previous analysis shows us that overall performance differs between sexes, thus training plans should be customized.
Being aware of this is useful but our focus must be on optimizing performance in each discipline and examining how each discipline affects overall performance.
I also wanted to find out if this applies to different triathlon distances, such as Olympic, Ironman, or Ultra Ironman?
To examine this, I compare two classifiers with the goal to determine whether they produce similar decision trees:
- one classifer is trained on the Olympic triathlon dataset from previous analyses
- The other classifer is trained on a new dataset from the Ironman Triathlon 2019
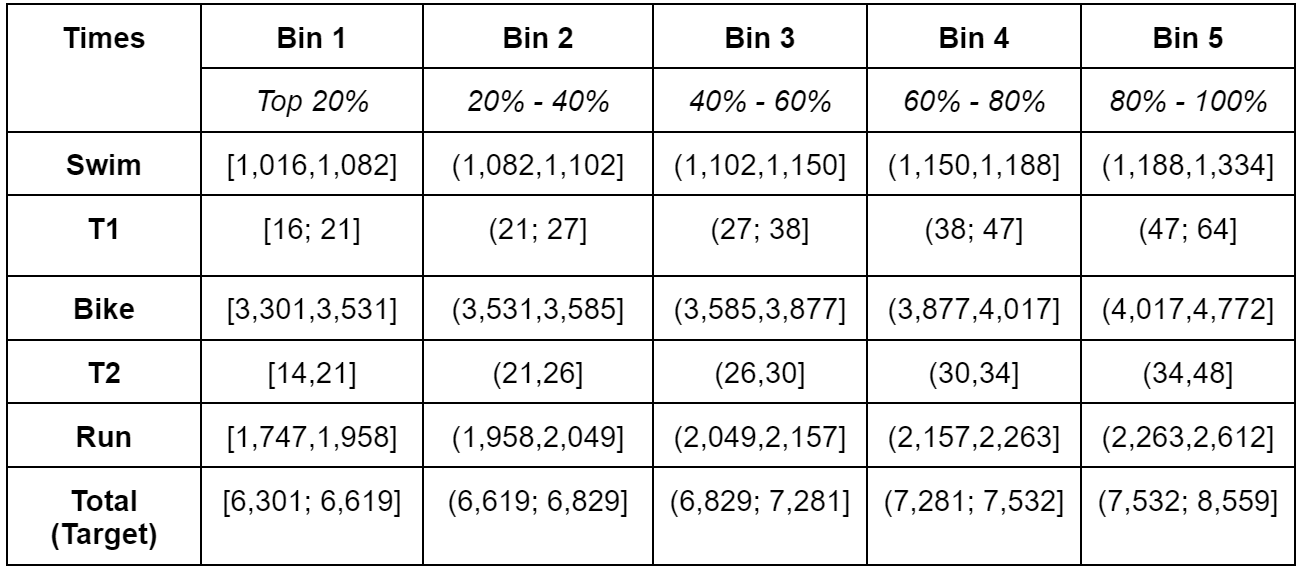
First, I'll preprocess the data by dividing the five key features (swim, transition time T1, bike, transition time T2, run) as well as the total time into five groups based on their frequency, as shown in Table 2 (below). This turns the problem into a five-category classification task.
Second, I'll use a Decision Tree, which is well-suited for modeling our current categorical data after preprocessing. The decision tree offers clear interpretability and captures nonlinear relationships between features and the target variable.
Finally, I'll compare the results from both datasets to determine if separate models reveal the same patterns in how individual disciplines affect overall performance.
The following is a summary of the tree model results across two datasets.
For a detailed analysis, you can download the decision tree inference from the Community Hub.
To aim for the top 20% of participants in both Olympic and Ironman models, focus on the decision tree branches where the leaves fall into bin 1.
If you're currently in a different performance range and wish to improve, download the workflow and experiment with the decision tree.
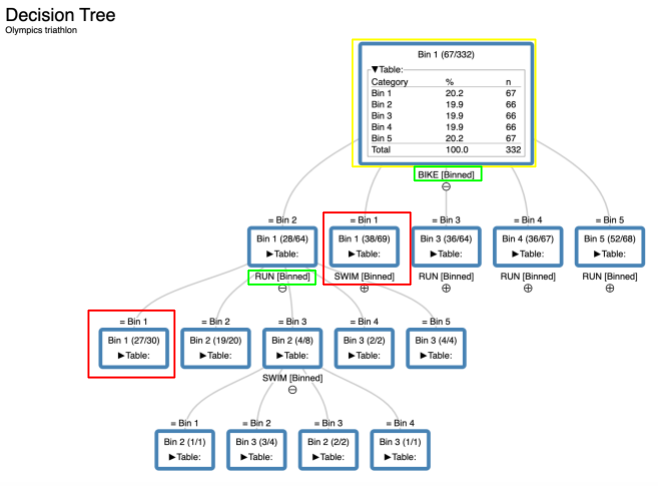
Olympic triathlon
The screenshot below illustrates the decision tree model applied to Olympics triathlon data.
Key takeaways:
- To be in the top 20%, the model strongly emphasizes performance in the Bike discipline. Being within the top 1-40% range significantly increases the chances of being among the top athletes overall.
- Secondly, the Run and Swim disciplines are also important. If an athlete is less proficient in biking (top 20% - 40%), they need to excel in the Run discipline.
- Conversely, a great performance in the top 20% for biking can lead to a top overall ranking by leveraging strong Swim performance.
- Lastly, transition time does not affect the chances of being in the top 20% among Olympic triathletes.
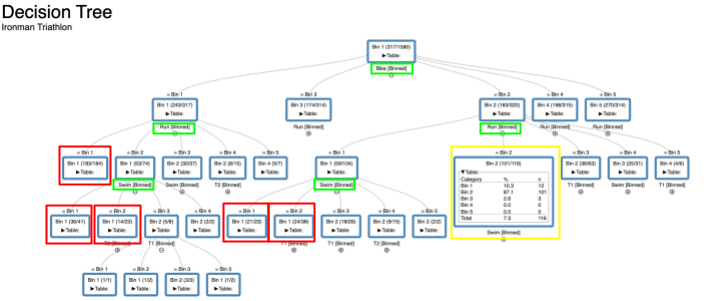
Ironman 70.3
The screenshot below shows the decision tree modeling on Ironman triathlon (final decision tree is depicted).
Key takeaways:
- The Bike discipline is the most important factor in determining if an athlete will be in the top 20% overall.
- Secondly, unless the triathlete is in the top 20% in both the Bike and Run disciplines, they still need to perform well in the top 40% of the Swim discipline to be in the top overall.
- Lastly, transition times T1 and T2 affect the chances of being among the top performers. The decision tree highlights this by selecting T1 and T2 as the next features to expand upon in two of the four red boxes.
Key points: How to achieve top 20% overall performance in triathlon for the two distance scenarios
For Olympic triathlons:
- Emphasize performance in the Bike discipline. Excelling in the Bike (0-40% range) significantly boosts the final rank to be in the top 20%.
- Run and Swim disciplines are also crucial: weaker bikers (20-40%) need strong Run performance; top bikers (top 20%) need strong Swim performance.
- Transition time does not affect the chances of being in the top 20%.
For Ironman triathlons:
- Prioritize the Bike discipline for determining top 20% placement.
- Top 20% in both Bike and Run disciplines is crucial; otherwise, strong Swim performance (top 40%) is necessary.
- Transition times T1 and T2 do impact the chances of being a top performer. The decision tree highlights their importance by expanding on these features.
So! Can you hope to be a triathlon medalist?
Absolutely!
Your chances of chasing Olympic glory aren’t limited by size, as our analysis shows that weight, height, and age have minimal impact. (You “just” need to excel in swimming, biking, and running, to be in the race for a medal 😉.)
Tip: in Olympic triathlons, you don’t need to excel in every discipline to succeed overall. In contrast, Ironman events require top performance across all disciplines and effective use of transition times.