Working in finance, you are responsible for communicating the overall health of the organization. This involves explaining how an individual’s action impacts the company's success, setting meaningful metrics to calculate the performance of different departments, and creating guidelines for future goals.
Not only do you know all the pieces of the organization, and how they fit together, but you also have a unique ability to see the entire organization in a way only few others can. From knowing the inner workings to the multifaceted layers of making the business work, you have the best seat at the table for strategic decision-making. By collaborating across the board, you transform the numbers into tangible stories. All while having to hammer out the standard monthly reports.
This means that as an accountant, an FP&A analyst, or an auditor, you often find yourself digging through piles of spreadsheets from various departments, manually tracking down the latest versions, consolidating the data within them, and transforming it to meet your reporting requirements month after month. Many finance teams have started using spreadsheets in conjunction with low-code analytics tools, like the KNIME Analytics Platform, to automate a lot of these repetitive tasks. However, developing the skills to use these platforms can feel intimidating at the outset. With the rise of generative AI, this transition is becoming easier than ever before.
For instance, the KNIME Analytics Platform now has an AI assistant, K-AI, that builds visual workflows for you based on your directions. You describe what you want to do with your data through a chat in plain English and it pops out the workflow for you. You can keep chatting with K-AI, describing what you need to do next with the data and K-AI keeps refining and building on the workflow until you have exactly what you need. K-AI also answers any questions you might have, hand-holding your way through upskilling and helping you become familiar with low-code analytics much faster.
Once your workflow is ready, you can save and reuse it for your calculations and reporting needs next month (or anytime you like) without the need to start from scratch. You can also share the workflow with your colleagues for their use. They’d be able to understand the process you followed quickly since it's laid out step-by-step and highly visually in the workflow.
Here’s a look at how you can create one such reusable workflow using K-AI.
Please note that K-AI is an experimental service and is actively being developed to improve its performance.Building a budget monitoring report using K-AI
Consider the financial close process. It is a recurring process in which account balances are thoroughly reviewed and irregularities and errors are addressed. When using spreadsheets, this involves a time-consuming approach to manually go through rows and rows of data. Moving towards a shorter and faster close process enhances accuracy and overall efficiency.
Let’s say that as a financial analyst, you are responsible for creating and maintaining a budget monitoring report for your company's projects. This involves regularly calculating and tracking the money used, assigned, and remaining for each project - information that is very useful as you close your books.
You work with a dataset, similar to the one below, containing key values to build this report.

K-AI can help you build a workflow, starting with a clean slate. You need to provide a prompt of what you would like to build and it does the rest for you. To create a budget monitoring report, we need to calculate the sum of money spent by the projects each year and also calculate the money assigned to the projects each year. Then, using these two, we can calculate the amount of money remaining for each project in that specific year.
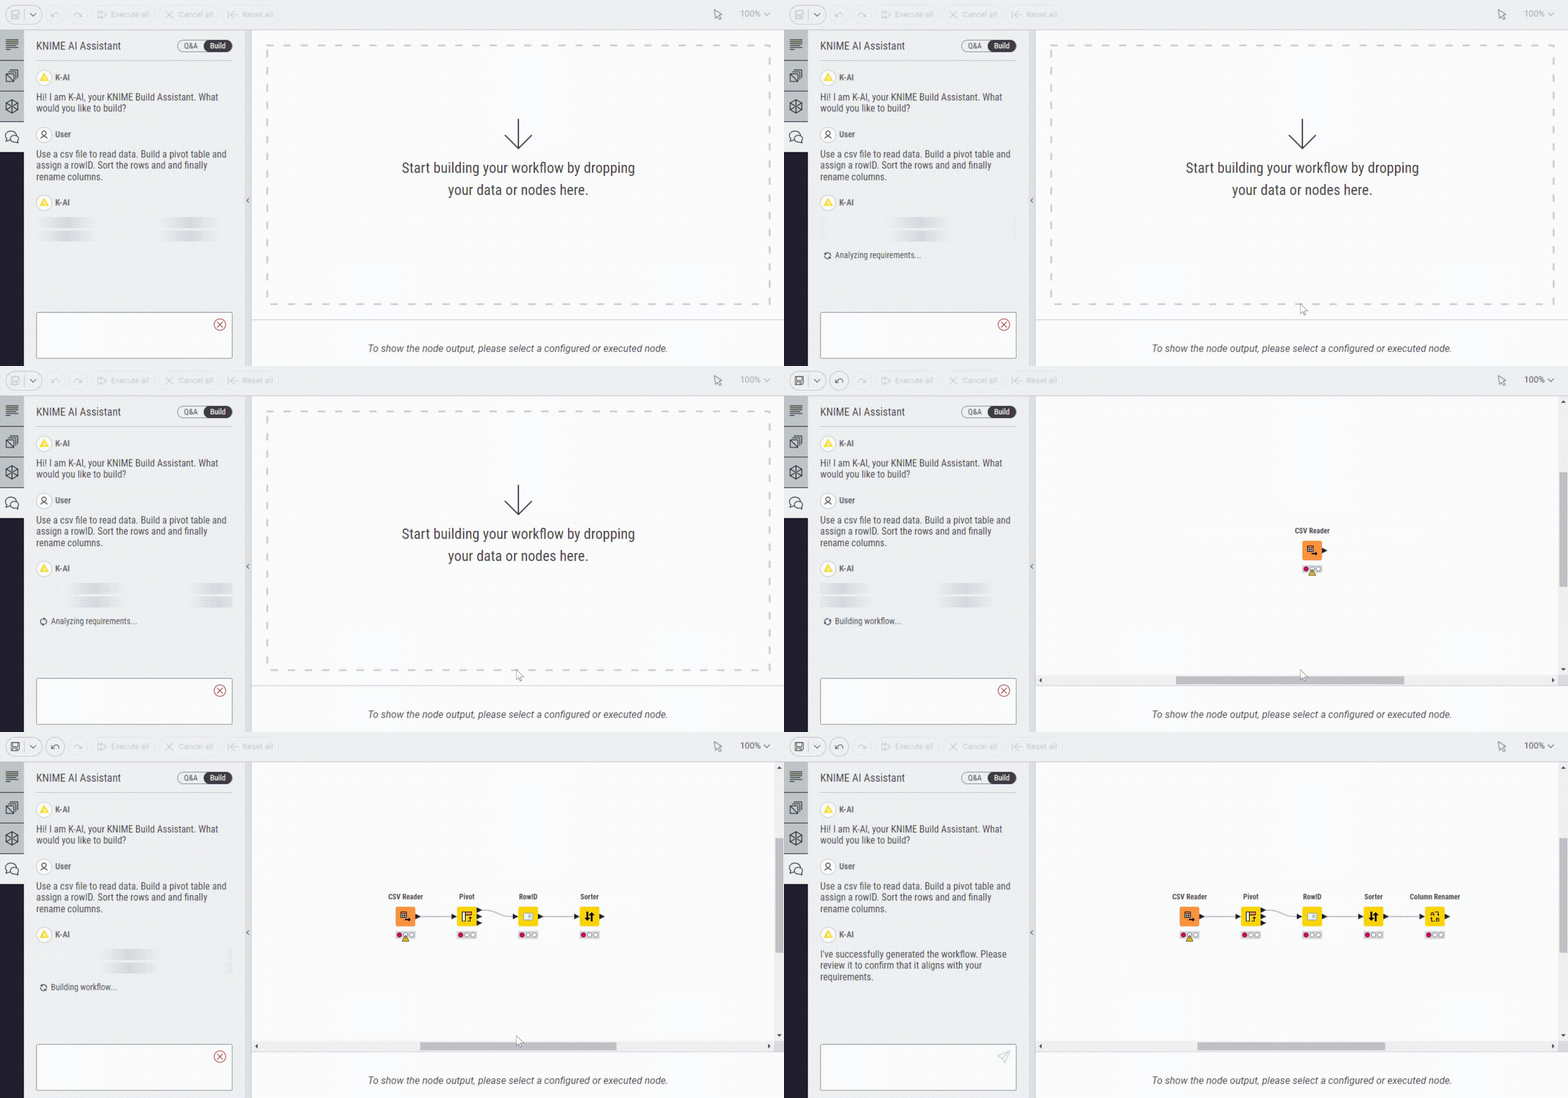
To begin constructing a workflow, we can use K-AI's build function to get started. You know that you'll need to read a CSV file and use a pivot table to calculate the money used by each project in different years. Following this we perform some data-wrangling tasks. So your prompt would be: "Use a .csv file to read the data. Build a pivot table, and assign a rowID. Sort the rows and finally rename the columns.”

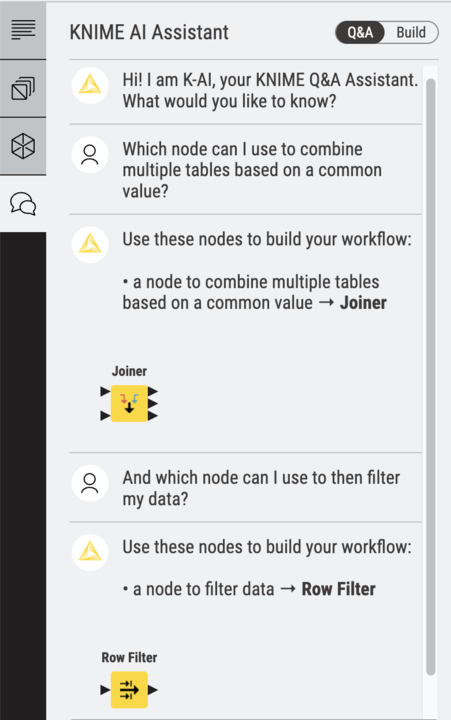
This AI-generated workflow stands as a good starting point which can further be fine-tuned and improved. For example, you might want to calculate time intervals between dates or group your data based on specific attributes, which is useful for aggregating financial data. A noteworthy feature of K-AI is the “Q&A” functionality. This can be especially useful in refining your workflow because it not only provides valuable suggestions for selecting suitable nodes but also offers access to additional resources.

In the Q&A mode, the assistant will answer your questions and provide instructions on workflow building. For example, you might want to know what node to use to combine different datasets, filter your data, change a string column to a date-time format, or what nodes to use for visualization. Apart from suggesting nodes, you can also find out how to configure them. Through informative responses to your questions, K-AI can guide you through the intricacies of building workflows, enabling more intuitive and efficient solutions.
Leveraging K-AI as a starting point to construct and refine your workflow can lead to efficient solutions that can enhance your everyday tasks. In our example, we can expand upon this workflow to obtain a more definitive and accurate solution to create a budget monitoring report such as the one shown below.

In this blog post, we've looked at how K-AI can be your practical ally, making your day-to-day tasks smoother and more efficient. Using AI to help you build reports you're already building is only the tip of the iceberg. AI can take your data analysis to a whole new level by delving deeper into your data and uncovering hidden trends, patterns, and correlations that might elude traditional analysis methods. AI can be valuable for continuous learning of new techniques and analytical approaches. Ultimately, AI can offer a nuanced understanding of the financial health of your organization and help you uncover valuable insights.
Navigate your journey with K-AI by your side. The newly introduced KNIME AI Assistant (Labs) extension, is available as of KNIME Analytics Platform 5.1.
Check out the KNIME for Finance space on the KNIME Community Hub for a curated collection of KNIME workflows. Or check out the KNIME for Generative AI collection.
Try it out yourself. Download KNIME—it’s open source and free of charge.
