If you’ve ever worked with data, you’ve likely faced situations where you needed to make decisions based on patterns or trends. Maybe you're trying to figure out which customers or how many will churn from your business, or you want to predict which products will need to be packed with bubble wrap.
A decision tree can help with these kinds of questions, and the best part is—contrary to expectations, you don’t need to know how to code or have a background in machine learning to create one!
In this guide, I’ll walk you through how to create a decision tree using KNIME Analytics Platform, a user-friendly tool that requires zero programming knowledge. If you’re new to data science, don’t worry—you’re in the right place.
By the end of this blog, you'll have improved your data science skills. You might even realize it’s not so difficult after all.
What is a decision tree?
A decision tree is just what it sounds like—a tree-like structure that helps you make decisions based on data. Imagine you’re trying to decide whether to wear a coat when you’re setting out for a walk. Your decision depends on conditions like the temperature, the season, or whether it's raining or snowing. A decision tree would use the combination of environmental factors to help you make that decision. A decision tree will break data into smaller and smaller questions, helping you predict an outcome based on previous examples and their outcomes.
Why use KNIME to build a decision tree?
KNIME Analytics Platform is a free, easy-to-use tool that doesn’t require you to write any code. It allows you to build and explore models like decision trees through a simple drag-and-drop interface. This means anyone can start building data models without needing to know programming or complex machine learning concepts. It's perfect for beginners and non-technical users—or even if you’re a pro and want to create something more accessible for your colleagues.
To follow along with this easy step by step guide, download KNIME Analytics Platform for free.
Step-by-step guide: How to build your first decision tree in KNIME
Let’s get you started with building a decision tree in KNIME, even if you’ve never touched machine learning before.
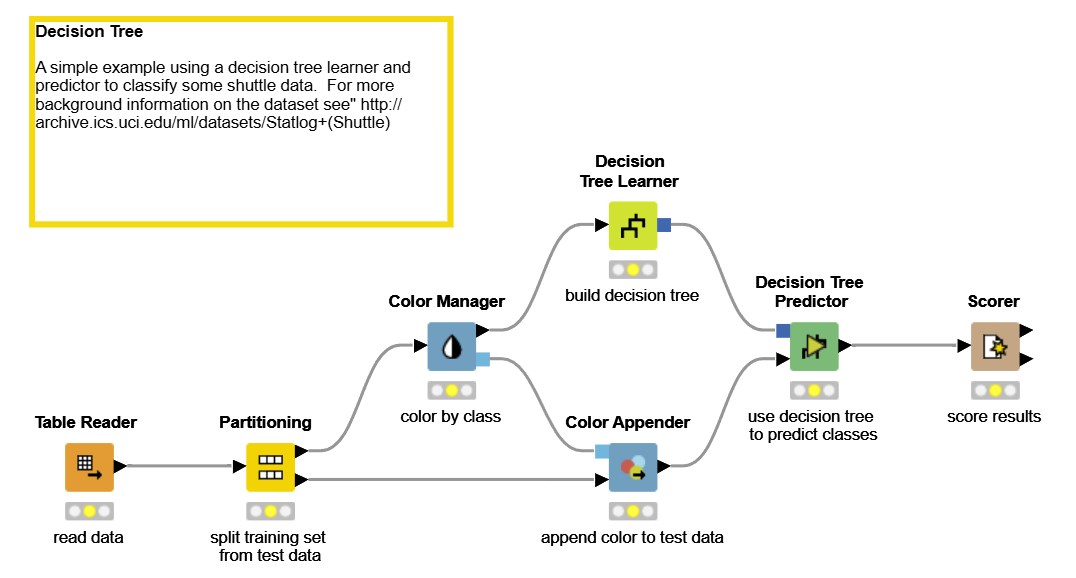
Here's a simple example that uses a decision tree in KNIME. You can download this workflow from KNIME Community Hub to try out yourself.

Step 1: Download and set up KNIME Analytics Platform
First, you'll need to install KNIME. It’s free and simple to install:
- Go to the KNIME website and download the version that fits your operating system.
- Follow the simple instructions to install the platform.
Step 2: Import your dataset
Once you’ve opened KNIME, the next step is to bring in some data to work with. You can use any data you have, or you can download a sample dataset (like customer data for predicting churn). Here’s how:
- Create a new workflow by clicking the yellow plus button on the right side of the home page in KNIME Analytics Platform.
- Drag your data set onto the workflow canvas and KNIME will import it with an orange data reader node. These types of nodes allow you to bring in data from a file, like an Excel or CSV file.
Step 3: Prepare the data
Before we can build the decision tree, we need to make sure the data is clean and organized. Don’t worry, this step is just about making sure everything is in the right place.
- Add the “Missing Value” node to handle any gaps in the data. For example, if some rows are missing values, this node will let you decide whether to fill them in or remove them.
- Use the “Column Filter” node to pick the columns (or features) that are important for your decision tree. If you’re analyzing customer churn, you might want to focus on columns like age, purchase history, and customer satisfaction.
Step 4: Split the data for training and testing
Now that the data is ready, we need to split it into two parts: one part to train the decision tree and the other to test how well the tree works.
- Drag the “Partitioning” node to the canvas and connect it to the output of your clean data. This node will split your data into training and testing sets.
- Set the split percentage in the node configuration. For example, use 80% for training and 20% for testing.
Step 5: Build the decision tree
You’re now ready to build your decision tree. Here’s where the magic happens:
- Drag the “Decision Tree Learner” node to the canvas. This node will create the decision tree based on the training data.
- Connect the training data from the Partitioning node to the Decision Tree Learner node.
- Configure the Decision Tree Learner by telling it what to predict. For example, if you're predicting whether a customer will churn, select that column as your target.
Don’t be intimidated by the variety of hyper-parameters available to change, once you understand the intricacies of the Decision Tree algorithm you can come back and take advantage of them without building a new workflow.
Step 6: Test the model to see how well it works
Once your decision tree is built, it’s time to see how well it predicts outcomes on data it hasn’t seen before:
- Drag the “Decision Tree Predictor” node onto the canvas and connect it to your test data from the Partitioning node.
- Run the Decision Tree Predictor to see the predictions for the test set.
Step 7: Evaluate the results and see if your tree made the right decision
To understand how well your decision tree performed, we’ll need to compare its predictions to the actual results.
- Add the “Scorer” node to the workflow and connect it to the output of the Decision Tree Predictor.
- The Scorer node will show you how accurate your model is and give you a simple evaluation, like an accuracy score and a confusion matrix (which shows how many times, and in which cases, the model got it right or wrong).
Don’t worry if this feels unfamiliar—just know that, most of the time, the higher the accuracy score, the better the decision tree performed! However, it’s always good to maintain your skepticism and be suspicious of models that perform far better than expected as this could be a sign of over-fitting.
Step 8: Visualize the decision tree to see your work in action
One of the most useful things about decision trees is how easy they are to understand visually. You can see exactly how the tree made its decisions.
- Add the “Decision Tree View” node to your workflow.
- Connect it to the Decision Tree Learner node and run it to see a visually appealing, easy-to-read diagram of your decision tree. You’ll be able to see which rules create different branches and how decisions are made.
Step 9: Save and share your workflow (you did it!)
You’ve just built a decision tree—without writing any code! If you want to save your work:
- To save a workflow click on the save icon at the top left of your KNIME Analytics Platform just below the Home button. To save the workflow with a new name click the drop down arrow and select the save as feature.
- You can also export the decision tree as an image or share your workflow with others who are interested in data science.
You’ve built your first machine learning model. What’s next?
Creating a decision tree may have sounded intimidating at first, but by using KNIME's visual workflows we hope you found it easier or more intuitive to build than you first thought! Whether you’re predicting customer churn, analyzing sales data, or exploring new data patterns, KNIME helps you achieve all of this without needing any coding skills.
And the best thing is, if you need to run the same decision tree in the future with different data, you can just upload a different data set and re-use the workflow you’ve built, saving a lot of time and effort.
The key takeaway? You don’t need to be a machine learning expert to do powerful things with your data. With KNIME, you can start small, learn as you go, and build models that help you make better decisions—one step at a time.
Now you've built your first decision tree, try out more machine learning techniques. KNIME has a lot more in store for you, and you’re ready to dive in.
