Customer churn is one of the most important KPIs because it monitors the health of the relationship between the company and its customers.
When a customer cancels, or does not renew, the contract is said to churn. Customer churn measures the percentage of cancelled or not renewed contracts on a given period.
- If customer churn is low, it means that the company’s product has gained the trust of the customers. This implies positive customer satisfaction and a solid customer base of loyal customers.
- If customer churn is high, it may indicate customer dissatisfaction, problems with the product or the service, or difficulty in maintaining customer loyalty.
In this article and video we show how you can calculate the customer churn KPI with KNIME Analytics Platform, an open source, low code data science tool.
With the KNIME solution you'll have a shareable solution that calculates the KPI automatically. If the input data for your calculation changes, the KNIME solution automatically recalculates the KPI values without any manual editing. And you can share the solution with colleagues on your finance team via a link to a browser-based data app.
The video below gives you an overview of what customer churn is and to build an automated solution with KNIME. The write-up below dives into the details.
Let's get started!
The task: Calculate customer churn KPI with KNIME
The customer churn KPI is defined as:

Since a common timeframe is “month”, we'll concentrate on the monthly Customer Churn KPI for the rest of this post.
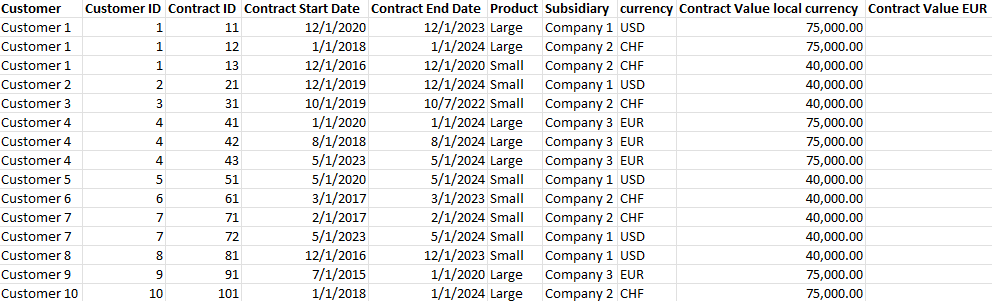
The data to calculate the churn on is a long list of contracts (Fig. 1), with a start date and an end date and some additional information about the bought products and the amounts paid. When the contract from customer X ends and is not renewed, this counts as a churn. This data usually comes from a CRM system, like for example Salesforce.
Let's look at the steps to calculate customer churn KPI:
- Collect the customer data and their contracts from the CRM system
- Define the start date and the end date for each customer, also considering overlapping contracts
- Count customers with start date and end date during the selected month
- Count the total number of customers in each month
- Compute the monthly Customer Churn KPI, according to the formula
- Visualize the KPI in a web-based data app
The workflows: Calculate and visualize monthly customer churn with a data app
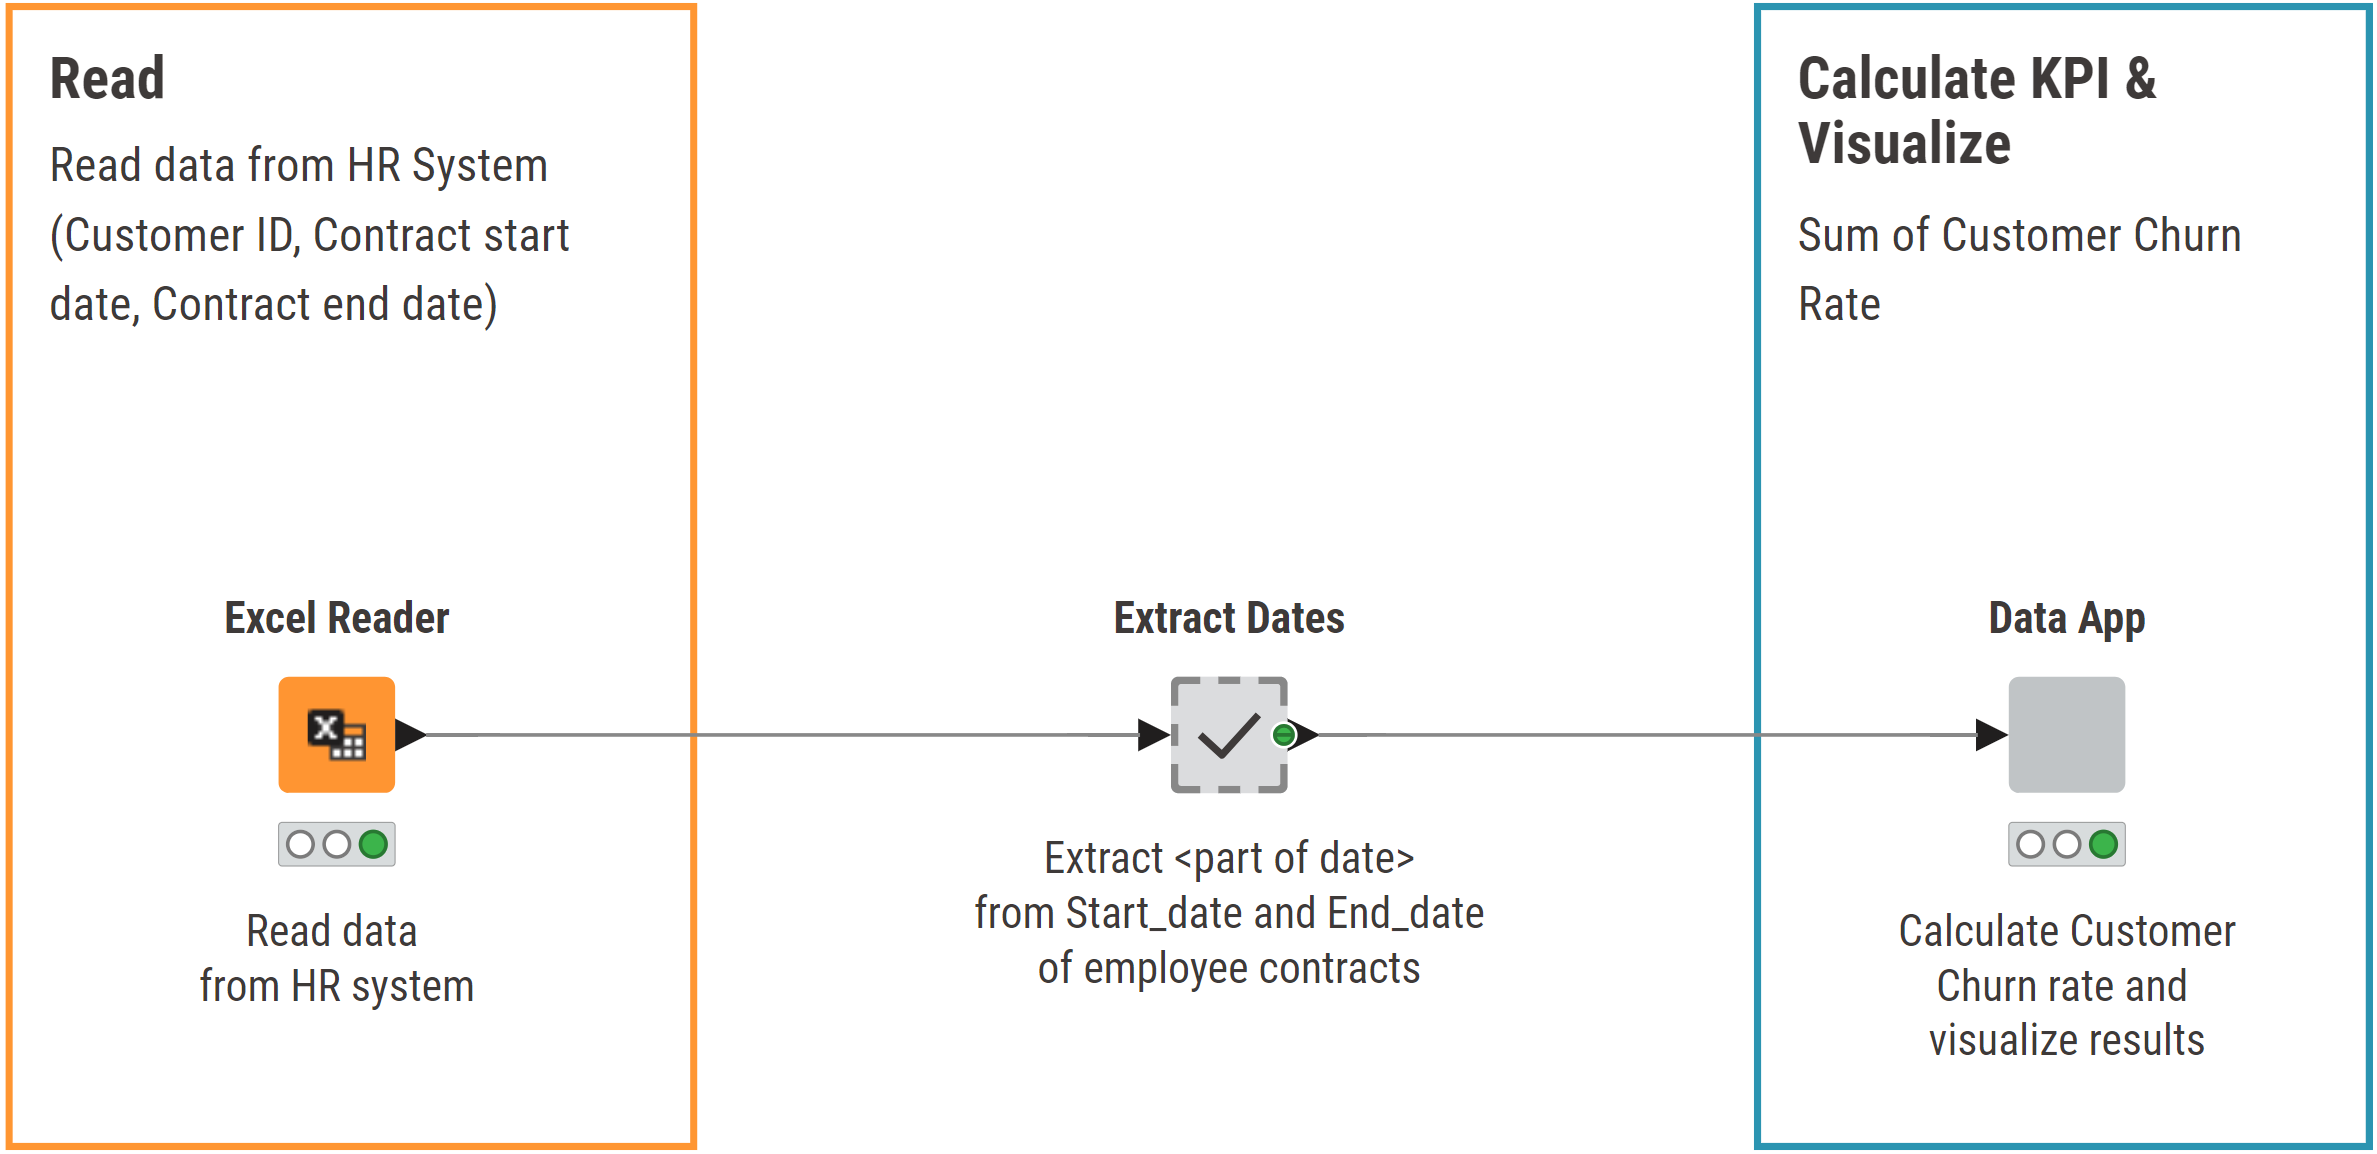
The Customer Churn KPI Monthly workflow calculates the Customer Churn KPI for a company. It's available for free download from the KNIME Community Hub. The workflow follows these steps:
- Read data from the CRM system with the appropriate reader node, like the Salesforce Simple Query node or a GET Request node. Here, we exported the data to an Excel file and used an Excel Reader node to read it
- Extract <Part of Date>, Year, Quarter, and Month from columns Start_Date and End_Date from customer contracts
- Calculate and visualize the KPI with a browser-based data app
The data app component (on the right):
- Enables the user to select the year for the calculation of the KPI values via the menu generated by a Single Selection Widget node.
- Extracts the data for the selected year.
- Calculates the start and end date for each customer, also considering duplicated and overlapping contracts (In the "Duplicate Row Filter" metanode).
- Counts the number of customers who churned in each month (In the "counts" metanode).
- Calculates the total number of customers in each month (In the "Customer" metanode).
- Calculates the monthly customer churn KPI (in the “Customer Churn” metanode).
- Prepares the data for visualization.
- Visualizes the KPI values in a web-based dashboard
If you've seen more of our “KNIME for Finance” articles, the formula displayed above for Customer Churn KPI will remind you of the formula for the Employee Turnover KPI. They are very similar, though not identical. The visualization however could be exactly the same. To avoid reinventing the wheel, we decided to adopt the “Data App” component from the previous employee turnover KPI workflow.
Reuse functionality with shared components
In KNIME Analytics Platform, it is possible to share functionality with other workflows / users by creating a component. This is how you do it:
- Open the workflow and select the component
- Right-click the component and select “Component” -> “Share”
- You will be prompted to select the location, on your local workspace or on your KNIME Hub space, where to store the component template
To use a linked version of the component template:
- Navigate to the location where the component template has been saved
- Drag & drop the component template in your workflow.
- A linked version of the component template will be created in your workflow.
- The linked version of the component is write-protected. If you want to change it, you need to disconnect the linked component from its template and create a local independent copy. To do that, right-click on the linked component and select “Disconnect link”.
Following this procedure, we created the component template “Data App” in Employee Turnover KPI Monthly, which is a public space on the KNIME Community Hub, and then we have created the linked component in our workflow. You can recognize that the “Data App” component in Fig. 3 is a linked component from the arrow in the right lower corner.
The results: Explore KPI year-on-year via interactive data app
We've shown how you can calculate the Customer Churn KPI and how to reuse a shared component from an existing workflow.
The visualization is indeed the same as for our KNIME solution for Employee Turnover KPI: because we reused the visualization component as a linked component. The shared component view includes a line plot to monitor the customer churn KPI trend and a pie chart to describe the customer churn for different office locations, exactly as it showed the trend and the pie chart for employee turnover KPI.
Looking at the view from the data app, you will notice that the Customer Churn KPI at the end of the year 2023 does not stay within the boundaries of acceptable values. This trend must be investigated and actions must be taken.
KNIME for Finance: Automated & reusable solutions
KNIME Analytics Platform gives you an intuitive user interface to access advanced data science techniques. Here we showed you a simple example of calculating and visualizing customer churn with this KNIME workflow.
The KNIME solution has three key benefits:
- It's shareable and user-friendly: You can share the link to the browser-based data app with other users
- It's automated: In scenarios where the input data changes, the KNIME workflow automatically recalculates the KPI values without the need for any manual editing
- It's connectable: With access to 300+ data sources and web APIs, you could connect to your data, independently of its location.
Try out the workflow yourself. If you're new to KNIME, here's the link to download KNIME. (It's open source and free to use.)