A/B testing, also known as split testing, is a method used to compare two versions of a variable to determine which one performs better. Alongside statistical analysis, A/B testing plays a fundamental role in data-driven decision-making, enabling organizations to make informed choices based on empirical evidence rather than intuition.
This article explores how to implement A/B testing for marketing analytics using KNIME, focusing on Analysis of Variance (ANOVA) and related techniques. We will apply these concepts in a practical use case featuring StyleScope, a fictional e-commerce fashion retailer.
The StyleScope challenge: Optimize conversion rates with A/B testing
StyleScope wants to optimize its conversion rates by testing different versions of its product landing pages. Despite steady traffic growth, conversion rates have plateaued.
The specific challenges they identified were:
- High churn rates on product landing pages
- Mobile users converting at half the rate of desktop users
- An average time on page of just 45 seconds
To address these issues, the data science team proposed testing two landing page designs:
- Version A ("old page") – The current minimalist design
- Version B ("new page") – A new interactive design with 360-degree product views
The goal is to determine which version results in a higher conversion rate, measured by the percentage of visitors who complete a purchase.
Key concepts in marketing A/B testing
While it might be tempting to jump straight into testing different webpage versions, a solid grasp of statistical concepts ensures we can trust our results and avoid costly mistakes in our marketing strategies.
Let's explore these fundamental concepts that will guide StyleScope's landing page optimization journey.
A/B testing has its roots in the early 20th century with Ronald Fisher laying the foundation for modern statistical hypothesis testing. Fisher’s methodologies are integral to the statistical approaches used in A/B testing today. In A/B testing, metrics are crucial because they help determine the effectiveness of the variations being tested.
Metrics used in A/B testing typically fall into two categories:
- Discrete metrics – Countable outcomes, such as whether a visitor completes a purchase (StyleScope’s primary metric)
- Continuous metrics – Measurements on a scale, such as the average time spent on a page
Analysis of Variance (ANOVA) is a statistical method used to compare means across two or more groups. For A/B testing, ANOVA helps determine whether differences in conversion rates between groups are statistically significant.
There are two common experiment designs to consider:
- Between-Subjects Design – Each visitor sees only one version of the page (A or B). This can be analyzed using an independent samples t-test or one-way ANOVA.
- Within-Subjects Design – Each visitor views both versions. This is less common in e-commerce but useful in controlled experiments, analyzed with a paired samples t-test or repeated measures ANOVA.
While t-tests are useful for comparing two groups, ANOVA offers greater flexibility, especially in multi-factor experiments or when analyzing interactions between variables.
Types of ANOVA Techniques:
- One-Way ANOVA – Compare means of multiple groups (e.g., different landing page designs)
- Factorial ANOVA – Analyze the interaction between two or more factors (e.g., how webpage design and marketing channels together influence conversion rates)
- Repeated Measures ANOVA – Compare the same participants across multiple conditions (e.g., if users rated their likelihood to purchase after viewing each design, repeated ANOVA measures would determine if their ratings significantly differ across designs)
- Mixed ANOVA – Combine between-subjects and within-subjects factors (e.g., test the effect of a webpage design (between-subjects factor) and time (within-subjects factor) on conversion rates)
A/B testing in KNIME: Build a workflow
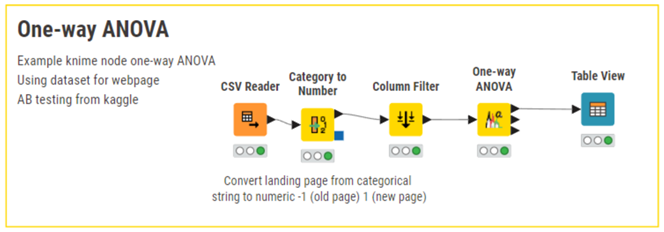
Here we demonstrate how to build and execute an A/B testing workflow in KNIME using one-way ANOVA to evaluate the impact of different landing page designs on conversion rates.
One-Way ANOVA KNIME Workflow

The one-way ANOVA test examines the impact of a single factor on a continuous outcome. In our use case, we are evaluating the impact of different landing page designs on customer conversion rates.
The single factor we are examining is the type of landing page design for StyleScope: “old page” and “new page”.
Our outcome metric is the conversion rate, measured as the percentage of customers who purchase from StyleScope after viewing the landing page.
Steps in KNIME Analytics Platform
First we use the CSV Reader node to load our dataset.

The dataset includes attributes such as:
- group, indicating whether the participant is in the control group (old page) or treatment group (new page);
- landing_page, indicating whether the participant viewed the old page or the new page (this feature will be the factor examined with ANOVA); and
- converted, which is a binary variable indicating whether the customer made a purchase (1) or not (0).
Next, we use the One-Way ANOVA node to compare the mean conversion rates across the two landing page designs to verify if there is a statistically significant difference between them. The One-Way ANOVA node computes the ANOVA table, including the F-statistic and the p-value.
Finally, we use the Table View node to display the ANOVA summary table. With this output, we can determine if the differences in conversion rates between the old page and the new page are statistically significant. If the p-value from the ANOVA test is below the significance threshold (in the example, 5%), we conclude that at least one landing page design leads to a significantly different conversion rate compared to the other.

Results: The obtained p-value is 0.171, indicating that the difference in conversion rates between the old page and the new page is not statistically significant at the 5% significance level (0,171>0.05).
Use versatile ANOVA techniques in KNIME for accurate analysis
Advanced statistical techniques can enhance experimental design and campaign analysis. With KNIME's intuitive visual workflows, marketers have easy access to these advanced methods and can turn data into actionable strategies.
Ready to try it yourself? Start building your own A/B testing workflows with KNIME Analytics Platform.
