This is part of a series of articles to show you solutions to common finance tasks related to financial planning, accounting, tax calculations, and auditing problems all implemented with the low-code KNIME Analytics Platform.
Variance analysis is a very common deliverable for finance departments because it helps reveal deviation from plans, keeps businesses on track towards their targets, and informs critical decisions. .
Financial variance analysis is one of the main ways businesses monitor and adjust for differences between financial plans and actuals. However, variance analysis often involves handling large amounts of data at different granularities, from different systems – which can make it time-consuming and error-prone, especially if done manually with spreadsheets.
KNIME Analytics Platform has a user-friendly, visual interface that simplifies connecting with data sources, processing data, and performing comprehensive variance analysis – allowing users to create a reliable and repeatable process that saves time and reduces the risk of error.
Watch the video below to get a summary of the solution. Or read on for a detailed write-up of the KNIME solution.
The task: Financial variance analysis reporting
Companies need to perform a comprehensive financial variance analysis to identify discrepancies between actual and budgeted figures. Variance analysis is crucial for financial management and decision-making because it highlights the areas where performance deviates from expectations. This allows businesses to investigate the causes of variances, and take corrective action.
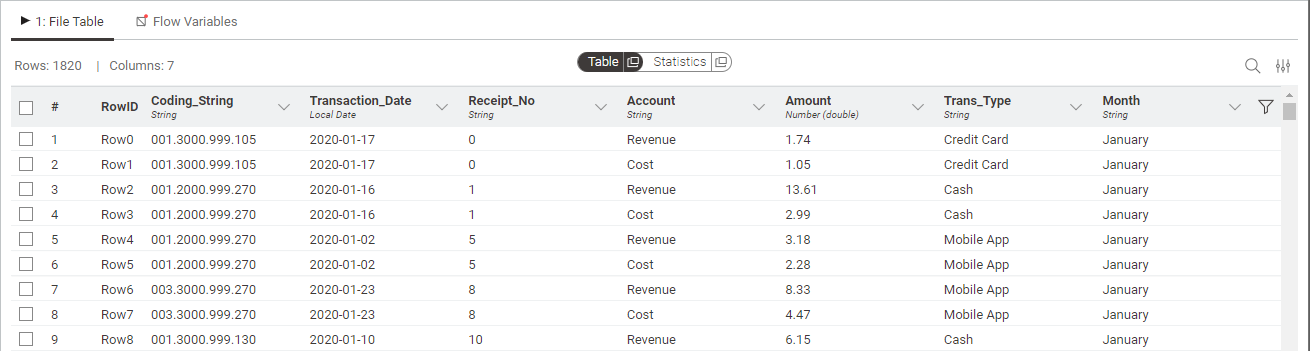
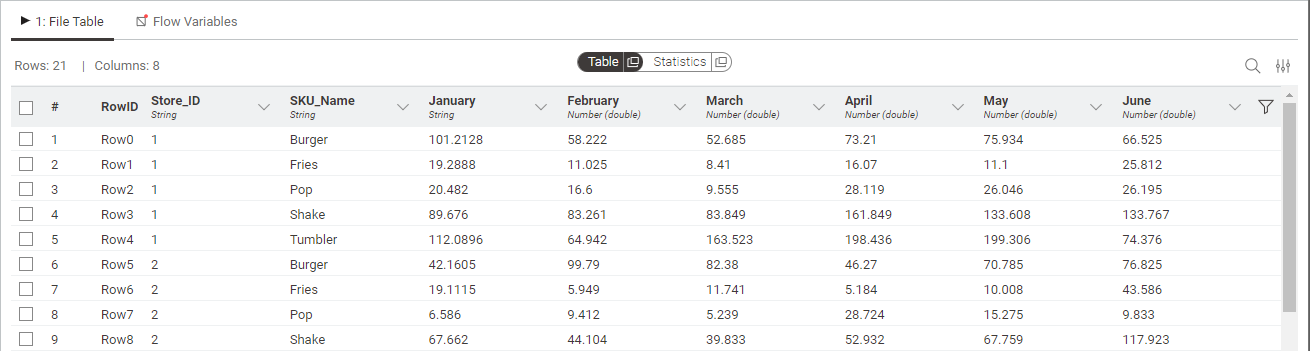
For this analysis, we will use two datasets containing actual (Fig. 1) and budgeted (Fig. 2) financial figures. The data simulates a typical finance environment, where actual results are much more detailed than budgets. In real life, these data sets may also be stored in different systems, so we have factored this into the solution as well.
The goal is to create a workflow that calculates variances and visualizes the results in an intuitive way that helps leaders better understand what happened and informs the next steps.
The workflow is intended to be reused each month without any changes. With KNIME you can build the workflow once and execute it reliably every day, week, or month, saving time and reducing human error.
The workflow: Streamlining variance analysis calculations with KNIME
The “Financial Variance Analysis” workflow is available to download in the KNIME for Finance space under “FP&A”.
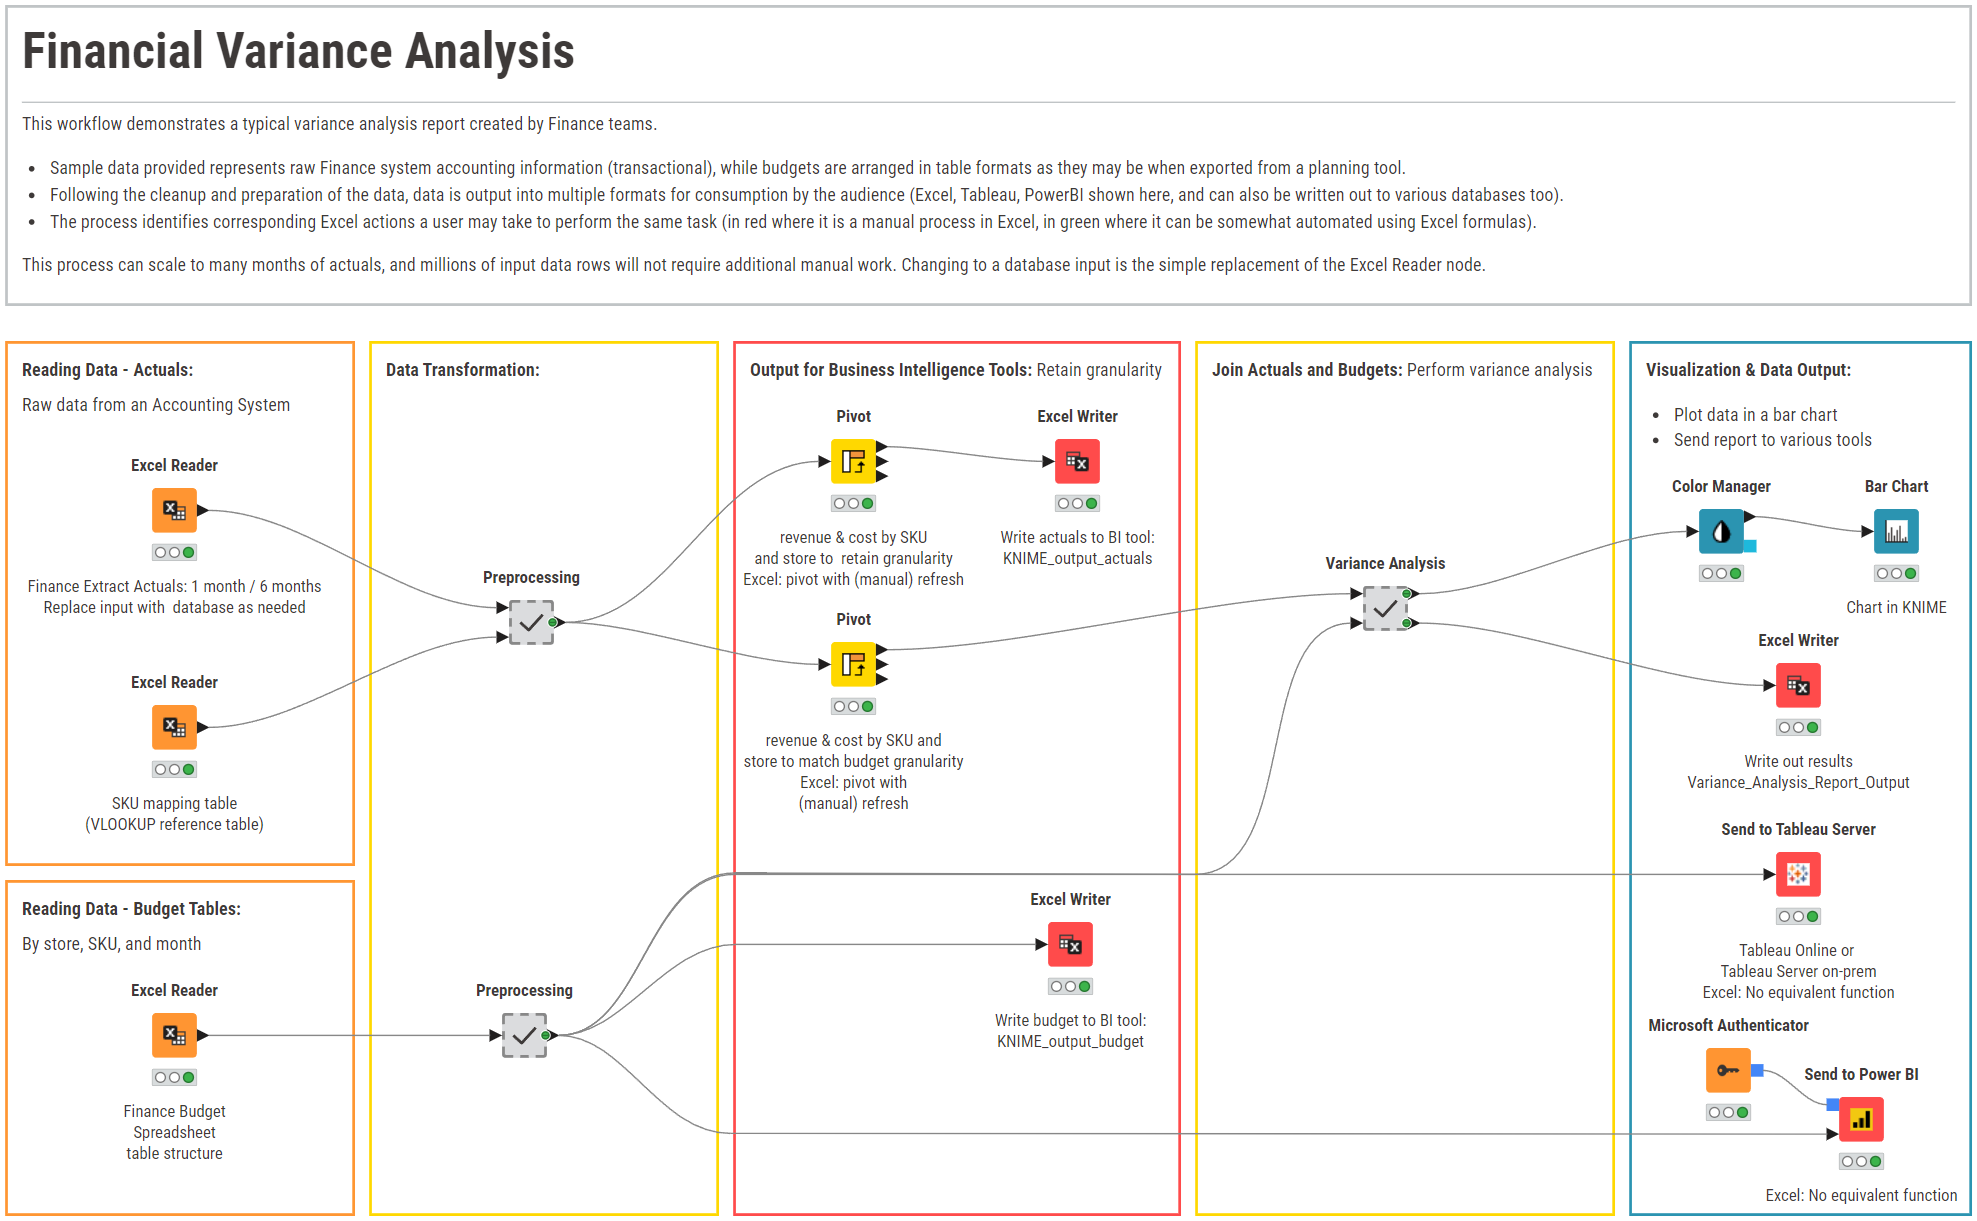
The workflow also outlines the equivalent spreadsheet functions in the node comments (where available) to allow users to connect to current tools they may be using.
Here’s a step-by-step breakdown of how the workflow works:
Reading data – actuals and budget tables
The workflow starts by importing the financial data, which includes actual and budget figures. In this example here, the data is stored in several Excel files which can be accessed using an Excel Reader node.
Actuals are imported at a transactional level of detail, while budgets are aggregated, for instance, by store (see Fig. 1 and Fig 2. above). The workflow is designed to withstand updates in the source data folder – and so the same workflow can be re-run as often as required by simply updating the data files in the original folder.
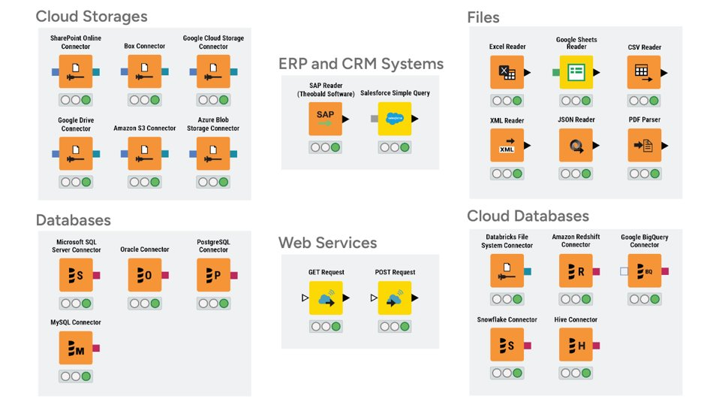
KNIME's versatile data connectors make it easy to pull data from multiple sources, whether it's an Excel file, a database, external systems, or an API.
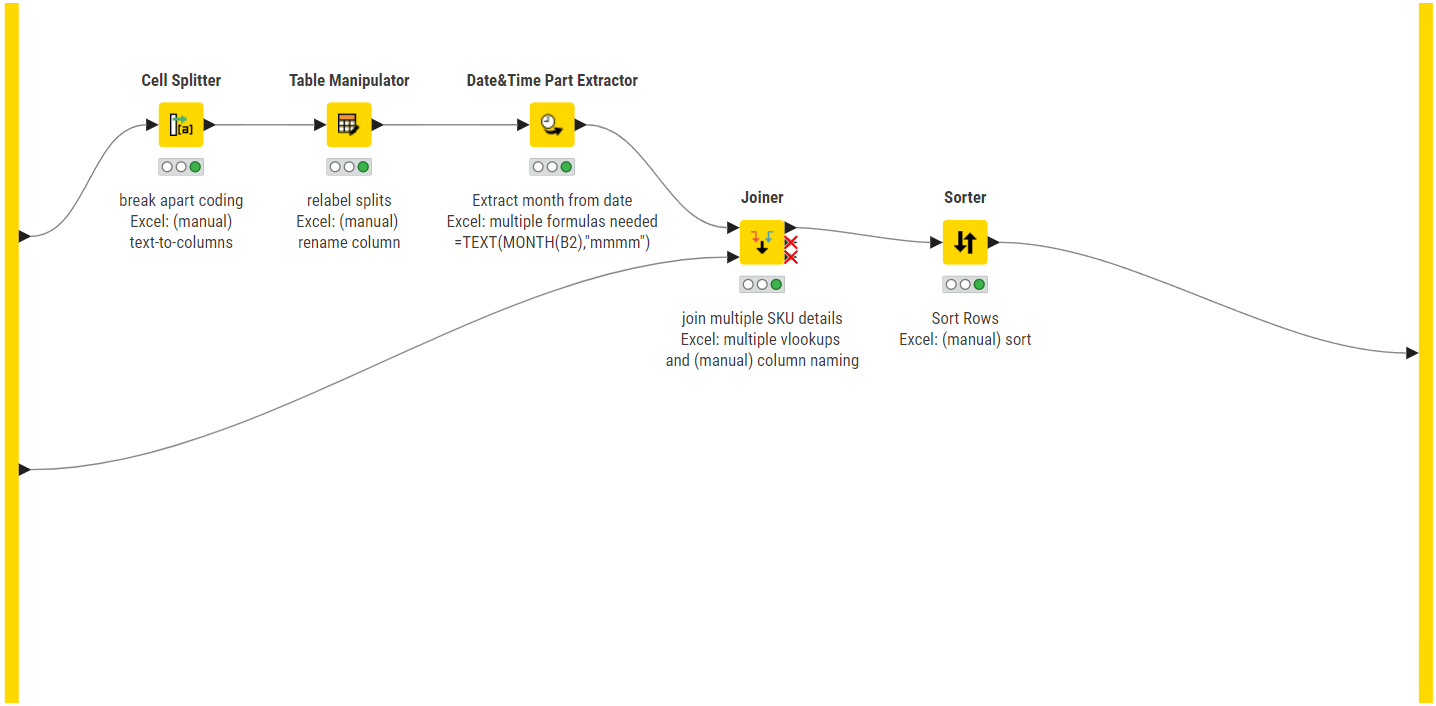
Data transformation
Next, the data is cleaned and prepared for analysis. This involves standardising data formats, joining to lookup tables, and ensuring data consistency. KNIME's powerful data manipulation nodes enable these tasks to be performed quickly, accurately, and consistently.
Output for business intelligence tools
Once the data is cleaned and transformed, it can either be used for further analysis, which will be done in the next steps, or it can be exported to external files for further use in other business intelligence tools.
To write back the actuals to an Excel file, we first aggregate the actual revenue and the actual costs by SKU and store using a Pivot node, then we use an Excel Writer node to save it as an Excel file. For the sake of completeness, we also write the preprocessed budget table to an Excel file.
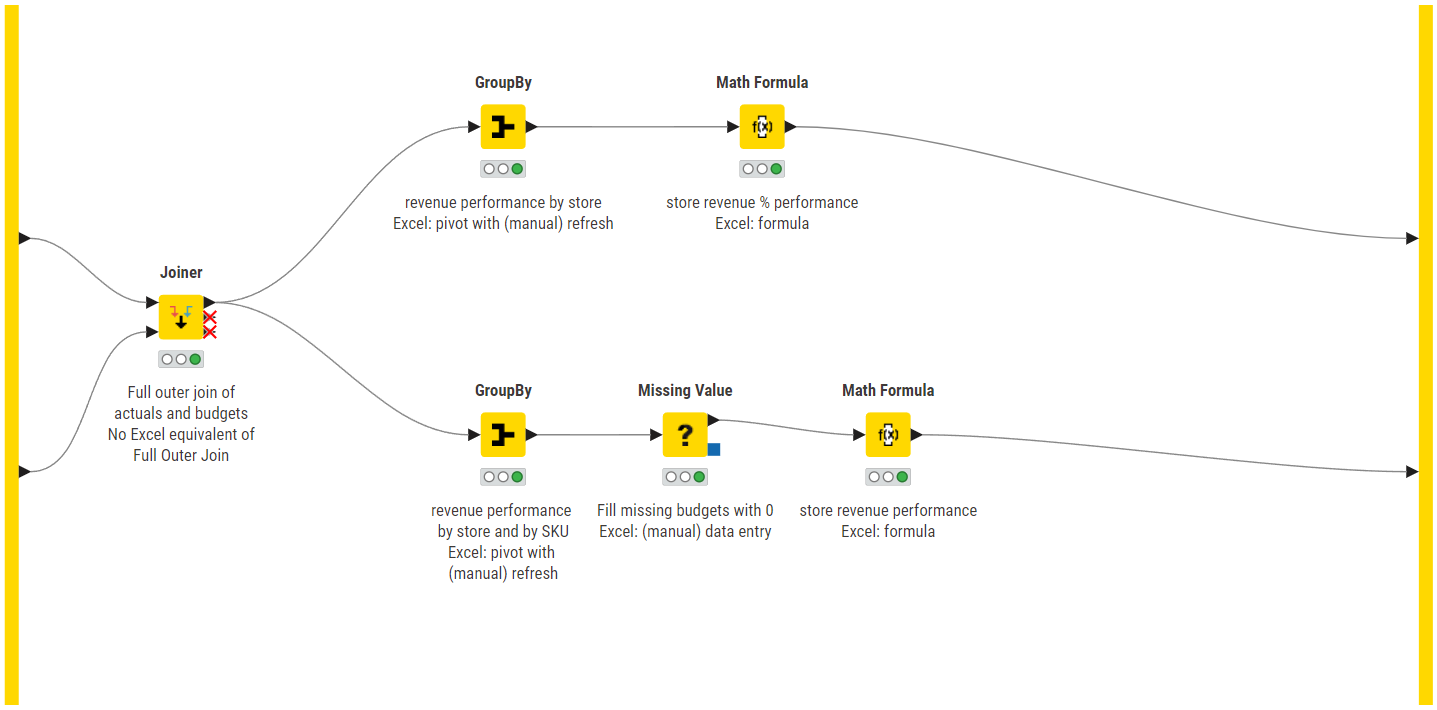
Join actuals & budgets: Perform variance analysis
With the data prepared, the workflow calculates the variances between actuals and budgets. This is a relatively simple calculation, done using basic arithmetic operations, which are easily implemented in KNIME without any coding using the Math Formula node.
Visualization & data output
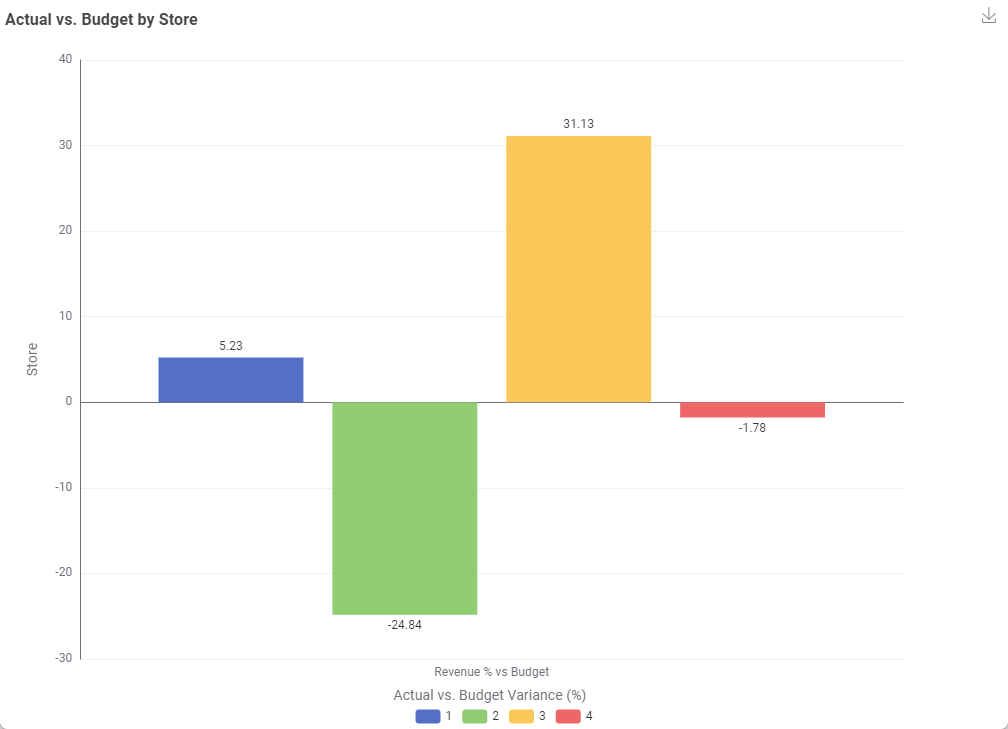
Some businesses rely on external business intelligence tools for enterprise reporting. With KNIME's open-source nature, the data is never locked-in.The KNIME View nodes offer countless options to visualize your data interactively. For example, using the Bar Chart node allows to plot the results, highlighting key variances and trends for management audiences (Fig. 7).
However, you can also export the data to other BI tools such as Microsoft Power BI (using the Microsoft Authenticator node and the Send to Power BI node) or Tableau (Send to Tableau Server node) or create a data app, which acts as an interactive data dashboard for your financial KPIs.
The results: Generating insights from variance analysis
The variance analysis conducted with KNIME can unveil critical insights into the financial performance of an organization.
In this example, we identified significant variances in the key financial metrics of revenue, costs, and profit.
Visualizations created with KNIME can highlight areas where actual expenses exceed budgeted amounts, and prompt further investigation into operational inefficiencies. Furthermore, as workflows in KNIME allow branching of analysis, it is always possible to drill down into sources of variance. This level of detail and interactivity is difficult to achieve with static Excel charts, highlighting one of the key advantages of using KNIME for financial analysis.
KNIME’s automated workflow significantly reduces the time and effort required for variance analysis. The automation ensures that the data is processed consistently and accurately, eliminating human error associated with manual data handling in spreadsheets. This consistency enables a more reliable comparison between actual and budgeted figures, providing a clearer picture of financial performance, and therefore better decisions. Once the workflow is designed, it can easily be scaled with business growth and expansion – ensuring that analysis costs do not grow with the business.
The comprehensive variance report generated by KNIME not only summarizes the variances but also provides actionable insights, enabling the organization to make informed decisions quickly. The ability to automate the entire process from data ingestion to reporting means that the organization can perform variance analysis more frequently, keeping a closer eye on financial performance and responding promptly to any discrepancies.
How KNIME helped calculate variance analysis
By using KNIME, we were able to overcome the limitations of traditional spreadsheet-based analysis. The platform's low-code environment allowed us to build robust workflows quickly and adapt them as needed. Benefits of the KNIME solution for Excel users include:
- Seamless data integration: Easily import and integrate data from various sources, avoiding the cumbersome manual processes required in Excel.
- Automated data cleaning: Transform and prepare data automatically, reducing the manual effort and errors associated with Excel.
- Enhanced visualization: Create dynamic, insightful visualizations that surpass the static charts available in Excel.
- Scalability: Handle large datasets efficiently, avoiding the performance issues commonly encountered in Excel.
- Flexibility: Quickly adapt and modify workflows to accommodate new data sources or analysis requirements without restructuring the entire process.
Explore more finance solutions on KNIME Community Hub
Find more finance solutions with low-code data science on the KNIME Community Hub in the KNIME for Finance space, and reach out to Day5 Analytics if you need help implementing any of these solutions.