Soccer, a sport loved globally, often sparks intense discussions. Historically, men's soccer has dominated the limelight, drawing more attention and praise from the public. But women's soccer is rising, sparking more discussions about the differences between women’s and men's matches. Are the differences rooted in gender stereotypes? Or are they real?
Remember the video published by Orange in France about how easily we can be fooled into attributing a game to men or women soccer players? So, is there really that much difference?

To answer these questions, Carlos Gomez-Gonzalez and his colleagues conducted an experiment where participants watched video clips of both female and male soccer players, sometimes knowing the gender of the players and sometimes not. The results revealed that when viewers were aware they were watching men's matches, they rated the performances higher. However, when the gender was not disclosed, the ratings for male and female athletes were similar. This experiment highlights a clear gender bias in the evaluation of soccer performance.
Recently, with the help of more advanced technology, clubs have started tracking a large amount of events, like passes, angles, and ball speed, during soccer matches. With this increased availability of data, soccer analytics has become more popular, not only among professionals but also among soccer enthusiasts. With the help of all that data, I will try to answer the question on whether there is a difference between men and women soccer and, if yes, what it is.
The tool I used to answer the question is the open source, low-code KNIME Analytics Platform. You can download it for free and check out the workflows I describe in this article.
First, I wondered whether a machine learning model could differentiate between the matches. I cannot distinguish between a women's match and a men's match. If neither a machine can, then maybe there is no difference. So my first step was to train a few machine learning (ML) algorithms to distinguish between men’s and women’s matches.
Secondly, if an algorithm is indeed able to distinguish between men’s and women’s matches, I should proceed to quantify the input feature importance and see which features are the giveaway for the classification and which are irrelevant.
This article is organized into three parts.
- Dataset and feature engineering. Here I describe the dataset and the input features I derived from the original data to more efficiently and more objectively describe each soccer match.
- Can ML algorithms distinguish a men's game from a women's game? Let’s experiment here with different machine learning (ML) algorithms and let’s discover if any of them can predict whether we are dealing with a men or women match.
- What are the differences? If any of the previous ML algorithms can indeed distinguish a women's game from a men's game, then I will run a feature importance analysis to determine which features help with the classification, if any.
All workflows used in this article are available for free download from the KNIME Community Hub space Sports Analytics.
Dataset and Feature Engineering
I used the dataset from Statsbomb, which provides information about the soccer matches of the 2022 Men’s FIFA World Cup and the 2023 Women’s FIFA World Cup. This dataset includes information on every event that occurs in a soccer match, such as passes, shots, fouls, and more. The events are annotated at the precise millisecond unit. On average, there are more than 10,000 events occurring in each soccer match. The dataset covers 64 matches for each event, resulting in a total of 128 matches, corresponding to 128 JSON files.
Feature Engineering: Distilling the Information
Since using 10,000 events as input features to train machine learning models might be overwhelming in terms of model size, training time, and feature importance analysis it was important to adapt the approach. After reading some literature on the topic by Luca Pappalardo and colleagues, Amod Sahasrabudhe and Joris Bekkers, , and James H. Hewitt and Oktay Karakus, I created 30 new features from the 10,000 events, as aggregated metrics, to capture the various technical and tactical aspects of a game. This eventually led to a 128x30 dataset, corresponding to 128 matches with 30 features for each match.
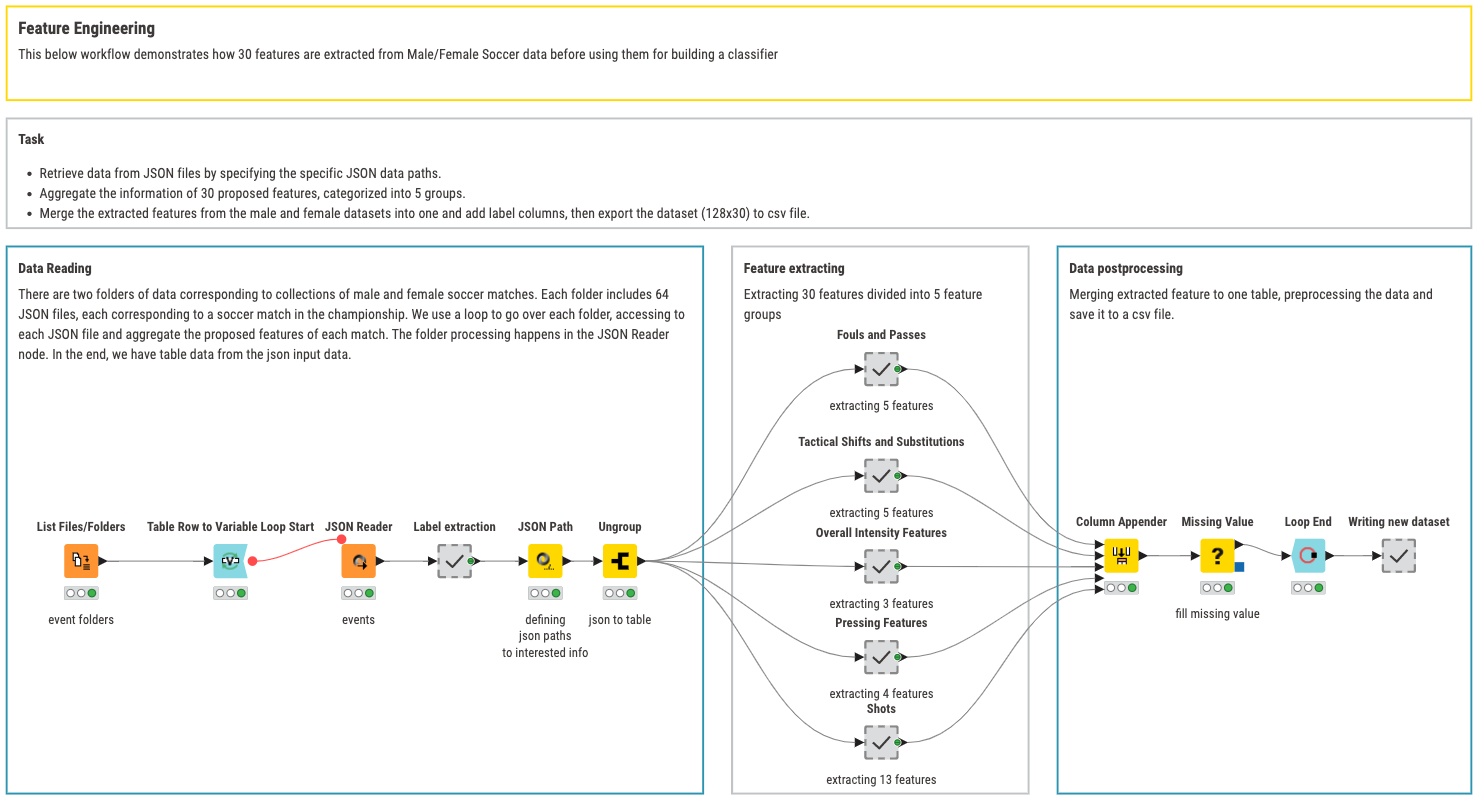
Feature Engineering
The 30 features for each game are organized into five groups:
- Fouls and Passes involves metrics such as the count of fouls committed, offside events, mean and mode of pass angles, and total pass lengths. Specifically, fouls are identified and counted based on referee decisions, while offside events are counted from specific event types and pass outcomes. Pass angles are measured in radians, and their mean and mode are calculated, alongside summing up all pass lengths.
- Tactical Shifts and Substitutions includes features such as the count of tactical shifts and player substitutions. Tactical shifts indicate changes in team formations and player positions during a match, while substitutions are counted both for the entire match and for the last 30 minutes of the regular playtime. These metrics help understand the strategic adjustments made by teams throughout a game.
- Overall Intensity is gauged through features like the total duration of all events, the count of events involving goalkeepers, and the total number of events in a match. Additionally, it includes counting events with irregular play patterns such as those originating from corners, free kicks, throw-ins, or counters. This group of features provides a comprehensive measure of the match's activity and intensity levels.
- Pressing metrics focus on the defensive aspects and ball recovery efforts of teams. It includes counts of ball recovery events, actions performed under pressure, counter-press events within five seconds of a turnover, and overall defensive events such as pressures, duels, blocks, and interceptions. These metrics uncover a team’s defensive pressure and effectiveness in regaining possession.
- Shots cover general shot information, shooting techniques, and distances. It counts the total number of shots, types of shots, and specific techniques such as backheels, half-volleys, and overhead kicks. Additionally, it measures the distance from the shot location to the goal and the average speed of the ball. These features are crucial for understanding shooting behavior and effectiveness in goal-scoring opportunities.
A detailed description of the 30 features can be found in the document Details_of_30_Extracted_Features.pdf in the top folder, along with the “Feature Engineering” workflow in the Soccer Analytics folder on the KNIME Community Hub.
Checking for Correctness
Before proceeding with the model training, I have run a quick data exploration to ensure that:
- The dataset does not contain heavily correlated features
- The classes are roughly equally distributed
- The data is normalized.
After drawing the correlation map of the dataset, I could see that some input features were strongly related to each other. To mitigate the impact of high correlation between features, I just filtered out the highly correlated features, by applying a threshold value of 0.7 (Johnson & Wichern, 2007) in the Correlation Filter node. Out of 30 feature columns, our dataset retained 22 features.
Notably, the features removed were: angle_mean, total_duration, total_no_events, count_under_pressure, no_counterpress_events, no_defensive_events, shoot_total_count, shot_normal.
After extracting 22 features from 128 matches (64 men’s matches and 64 women’s matches), I added a target column with the labels “Male match” and “Female match”. Z-score normalization was applied to make sure the data follows a normal Gaussian distribution. This allows for more freedom in the choice of the machine learning algorithms, for better accuracy, and for easier interpretation.
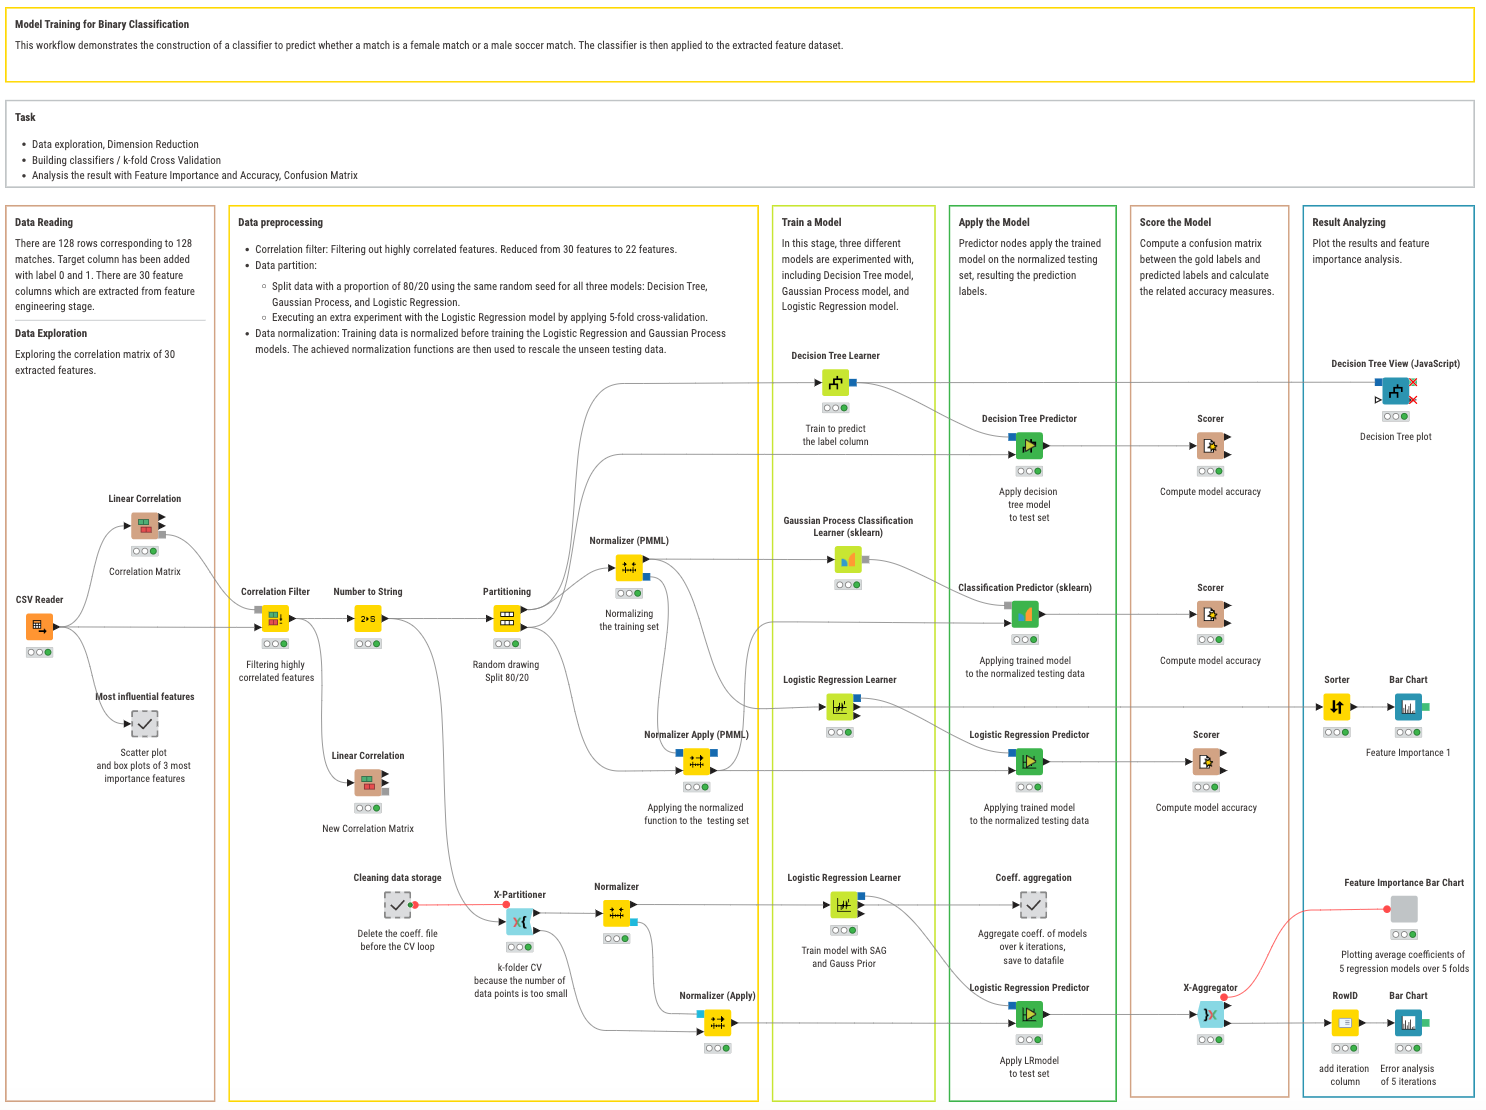
Can a machine learning algorithm distinguish between men’s and women’s matches?
Due to the small size of the dataset (128 rows only), I did not use overly complex models to avoid the risk of overfitting. Instead, I chose three simple machine learning models that have the added benefit of easy interpretability.
- Decision Tree, a non-parametric method that excels in handling non-linear relationships and complex decision boundaries. The model is intuitive and easy to interpret, generally performing well with small datasets without much hyperparameter tuning. However, it may be prone to overfitting and might be difficult to scale to larger datasets.
- Gaussian Process, a non-parametric Bayesian method that provides flexibility and uncertainty estimates. The model can work well with small datasets, particularly when data is sparse or noisy. However, it is extremely computationally intensive and does not scale well for large datasets.
- Logistic Regression, a parametric method that offers interpretability and efficiency in estimating parameters. The model is less prone to overfitting but assumes linearity between the log-odds and the target, limiting its ability to capture non-linear relationships in the data.
All models were evaluated using an 80/20 data splitting strategy. All three models produced an accuracy greater than 80% and in some cases more to 90%, which proves that all three ML models, after training, were able to distinguish between men’s and women’s matches. What the human eye could not see clearly, the machine could definitely understand.
Table 2: ML Model Performance in accuracy and Configuration Overview
| Model | Configuration | Accuracy (%) |
| Decision tree | Quality measure: Gini index Pruning method: MDL pruning | 80.769 |
| Gaussian Process | Kernel = RBF | 96.154 |
| Logistic Regression | SAG • Learning Rate = 0.05 • Prior distribution = Laplace | 88.462 |
Gaussian Process provided the best accuracy, but it’s difficult to scale up to larger datasets and hard to interpret. Logistic Regression however offered the best interpretability. Therefore, I focused on this model for the rest of this article.
Given the small size of the dataset, I also ran a 5-fold cross-validation routine on the logistic regression model, to check for its robustness. An average accuracy of 93.69% and a standard deviation of 4.84 were shown across the 5 folds (80/20), indicating some degradation in performance yet within acceptable boundaries. For the next steps I used the average results from this 5-fold cross-validation.
The workflow Model Training implementing the training, testing, and cross-validation of the selected machine learning models is also available on the KNIME Community Hub.
Top differences between men’s vs. women’s soccer matches
The ML models can all easily distinguish between men’s and women's matches. So, what gives away the type of match? Which input features are responsible for the prediction? Is it playing style? Speed? Strength? Fair play? Tactics? Experience? Let’s check the feature importance to unveil the mystery.
The Logistic Regression model is the easiest to investigate. Indeed, its coefficient values hold a measure for the importance of each input feature in the classification process. In figure 3, the coefficient values are plotted, after being averaged on the 5-fold runs.
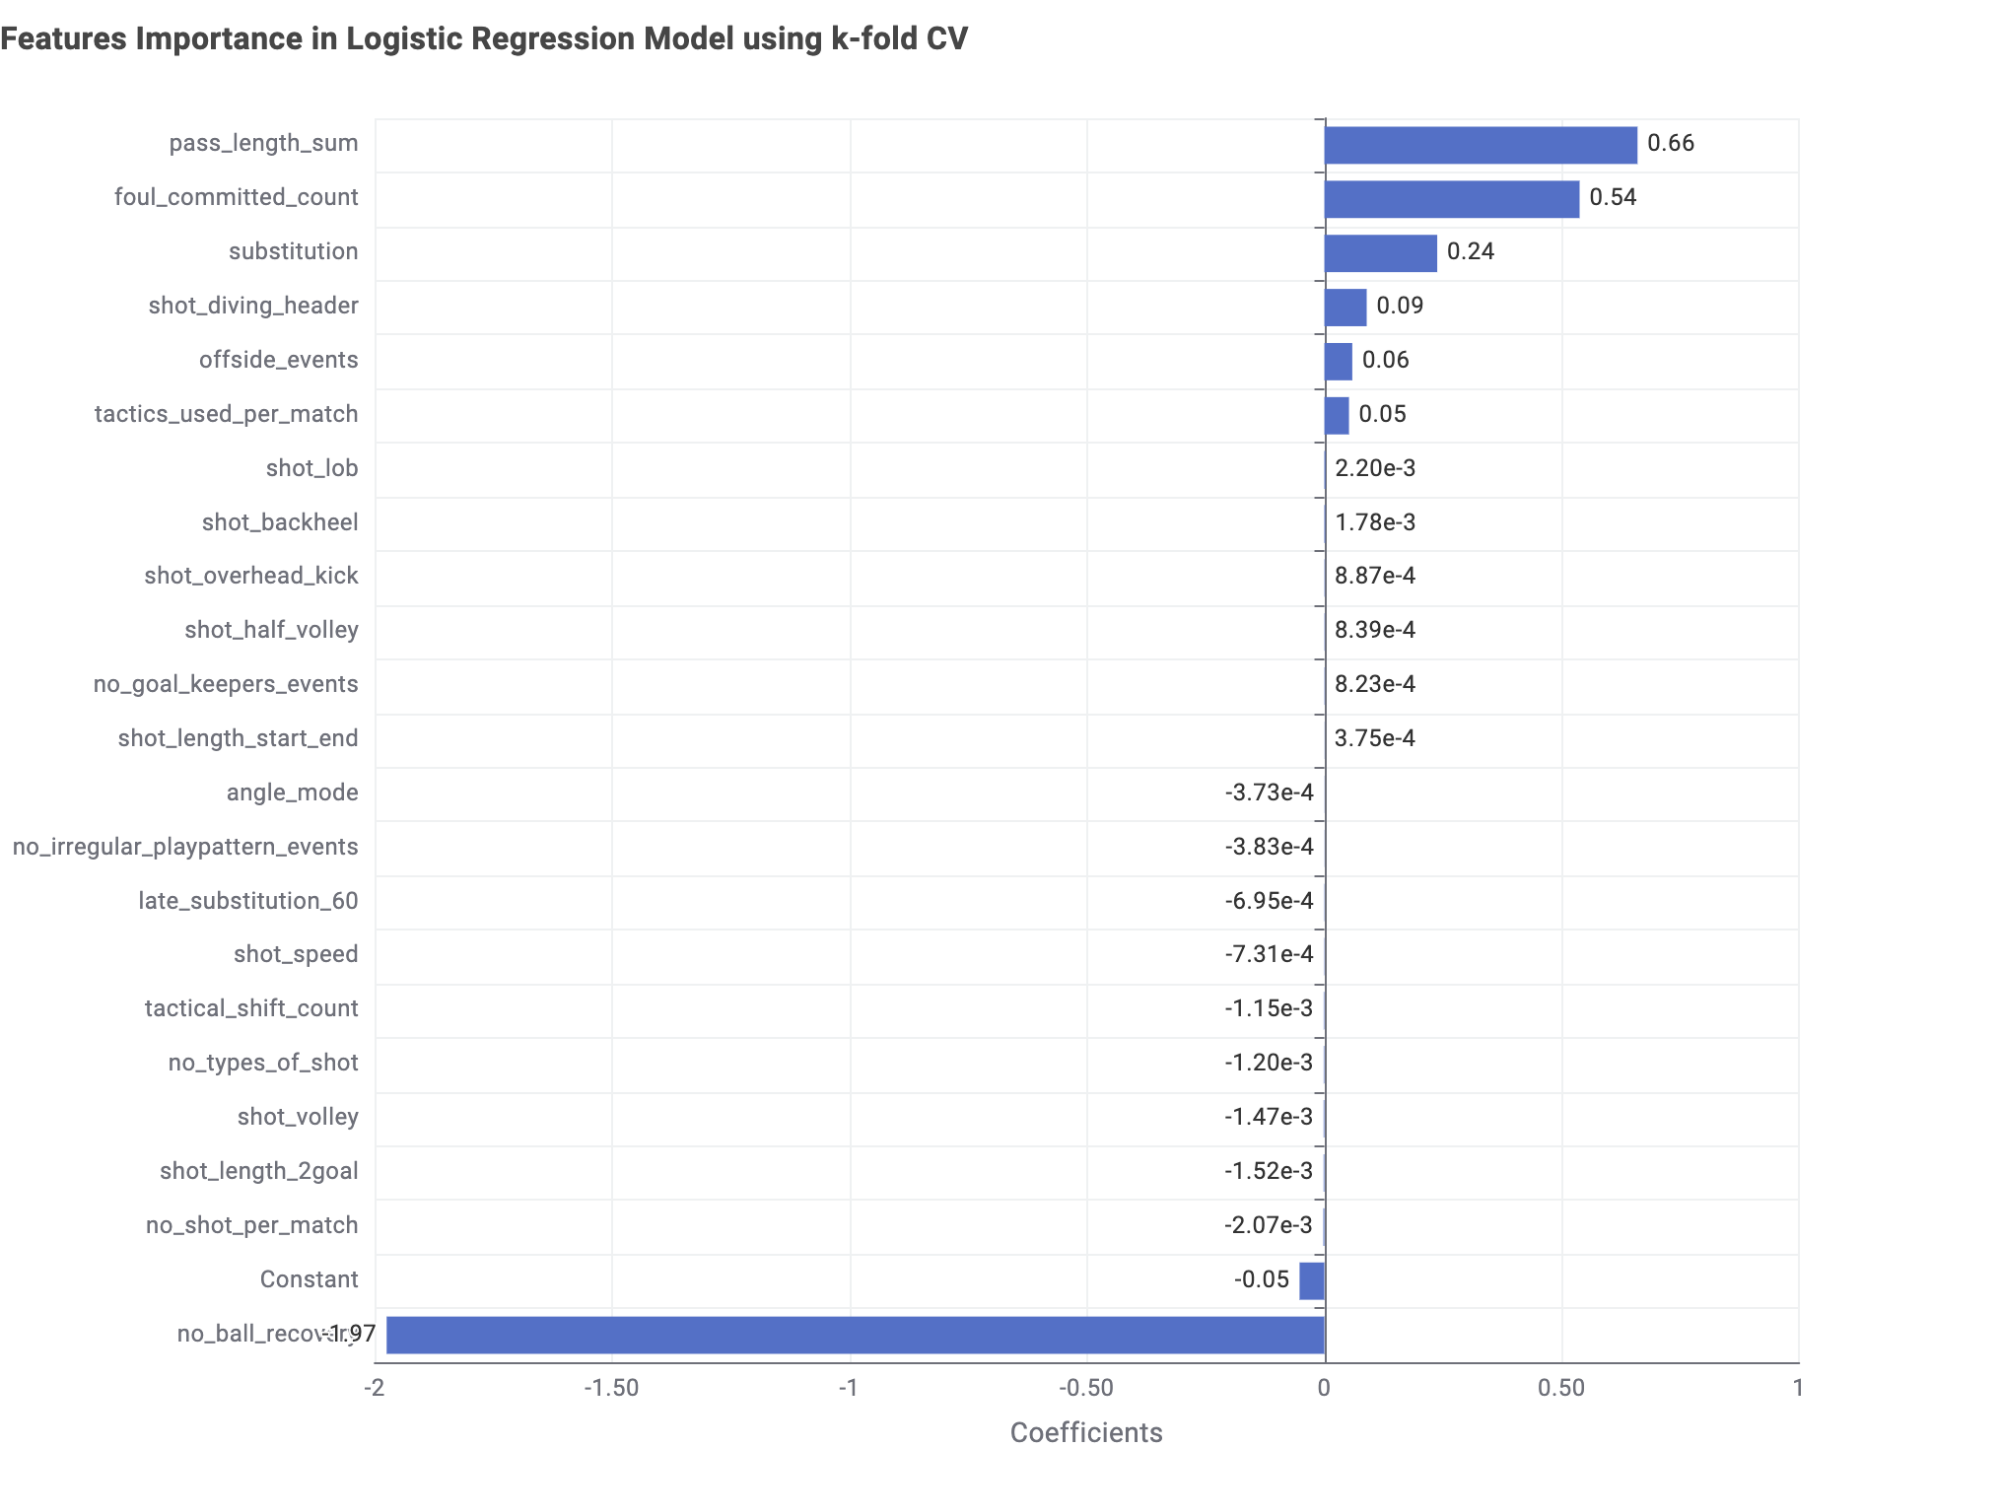
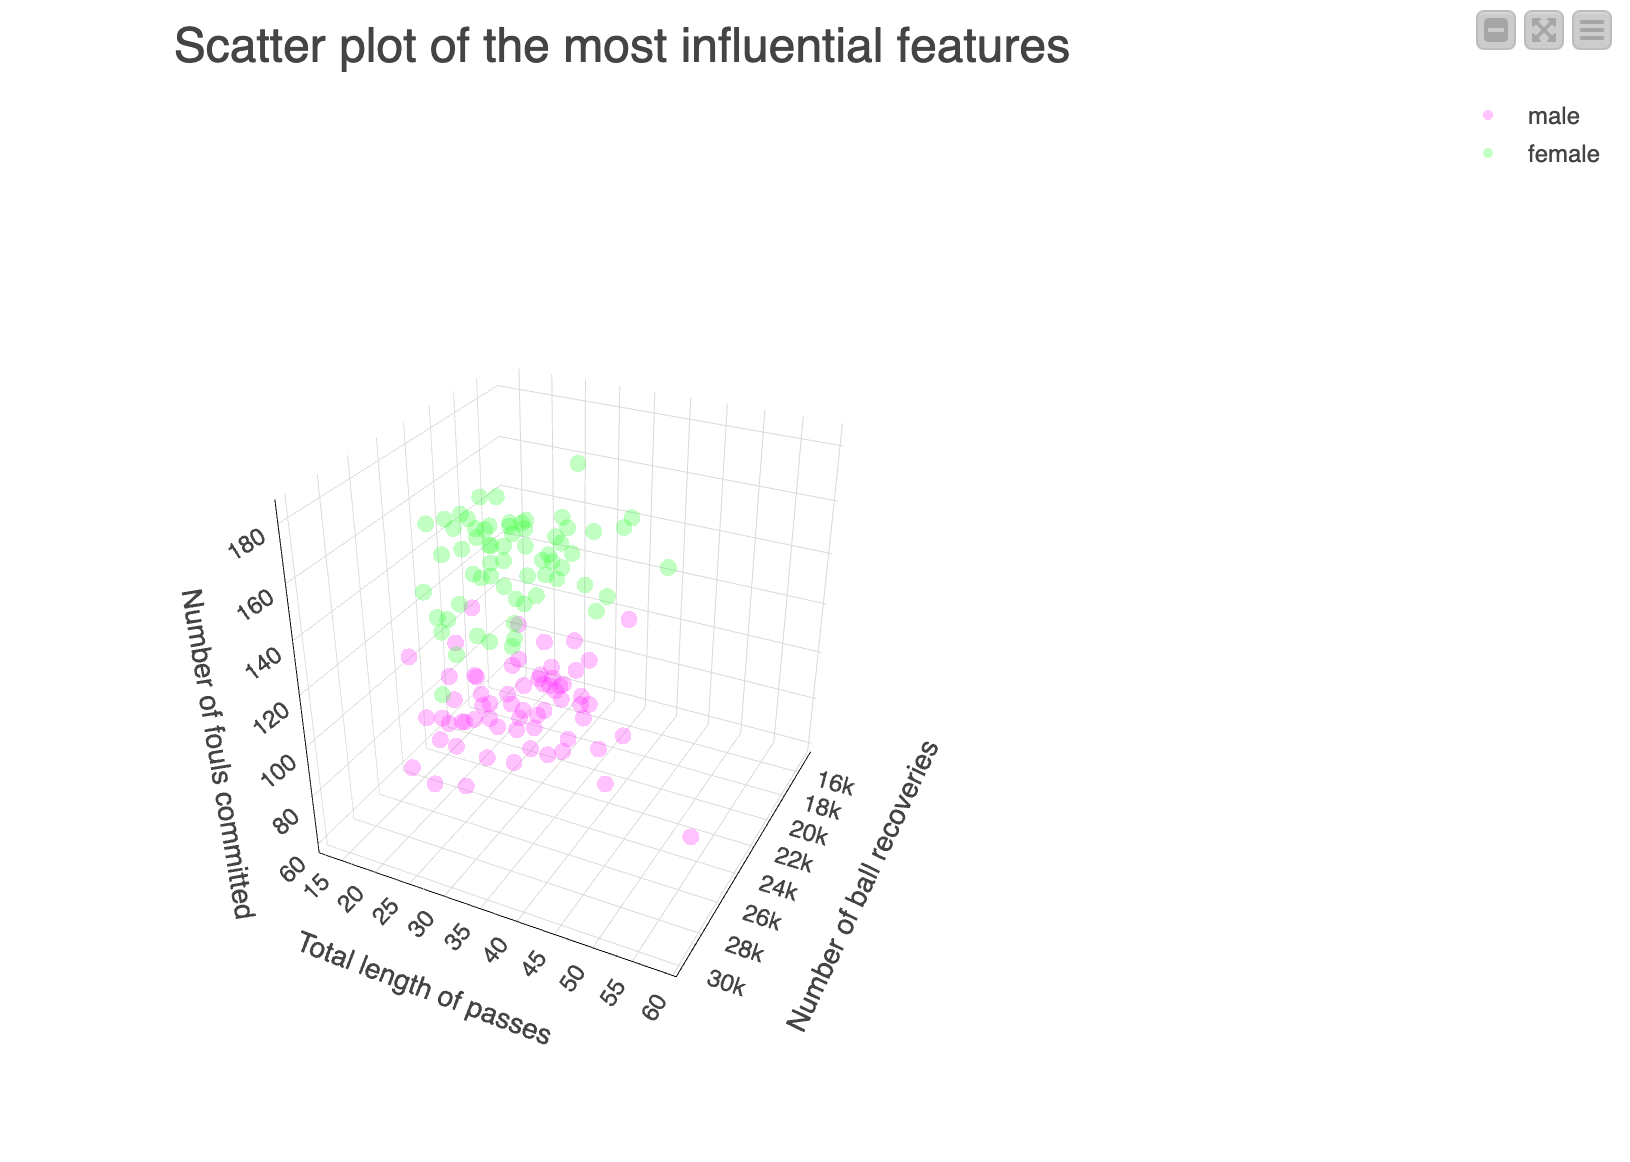
Most influential features
According to my trained logistic regression models, the top most influential features (as greater than a threshold 0.1 in absolute value) are:
- Number of ball recoveries (no_ball_recovery)
- Total length of passes (pass_length_sum)
- Number of fouls committed (foul_committed_count)
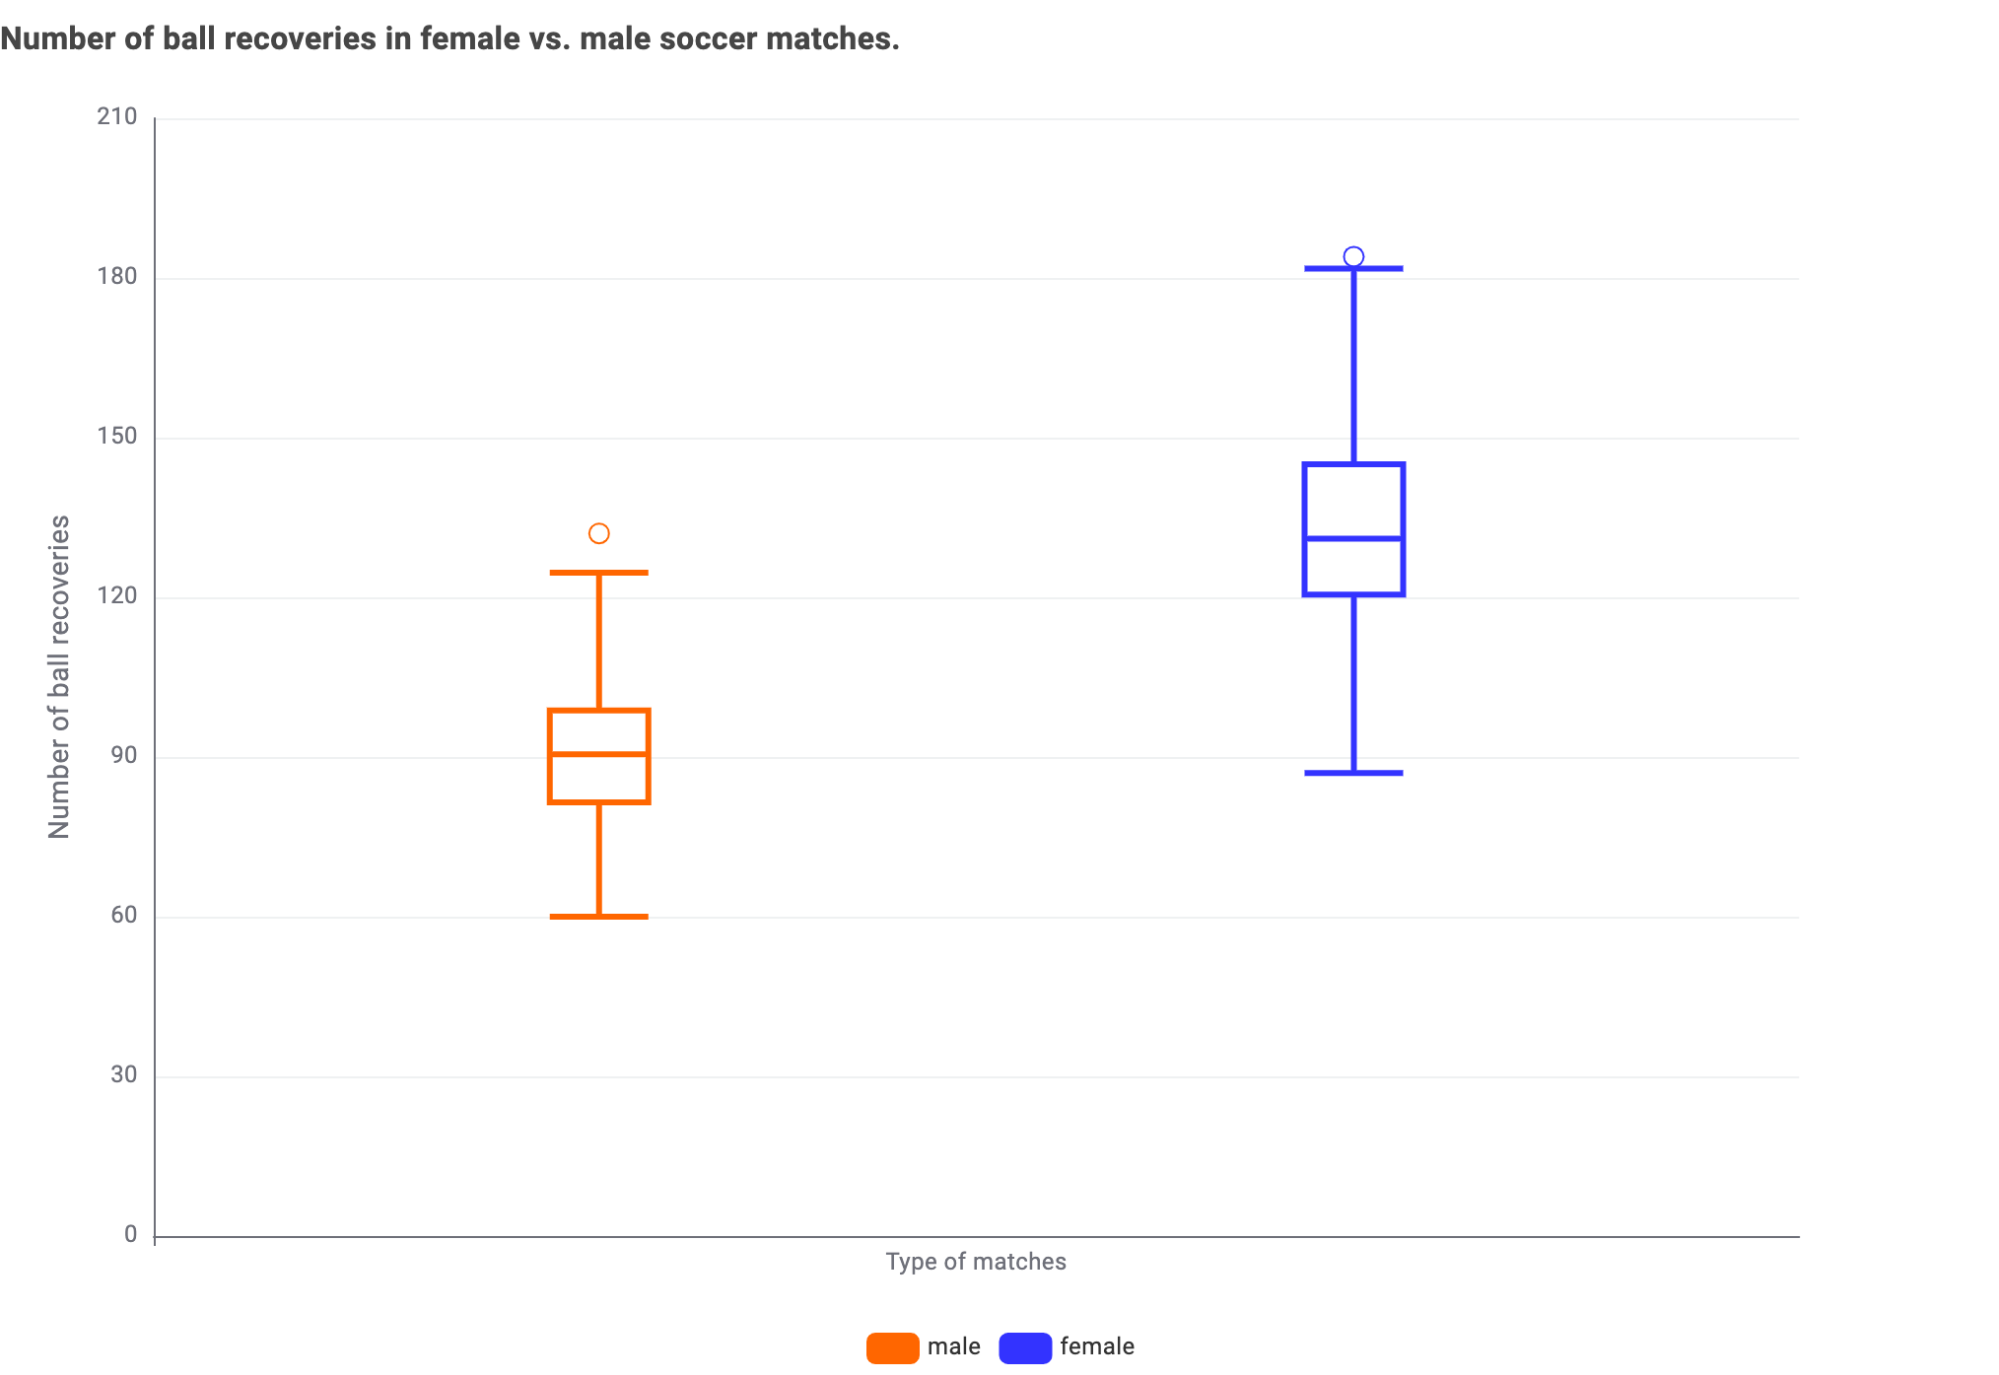
The number of ball recoveries plays the most crucial role in the distinction between men’s and women’s matches. It reflects a player's ability to regain control of the ball and to disrupt the opponent's attack. Observing the following box plot, we see that women’s matches show a significantly higher number of recovery balls. This feature is part of the pressing feature group, indicating that women's matches are played with persistence until the last usable ball and inch of the field.
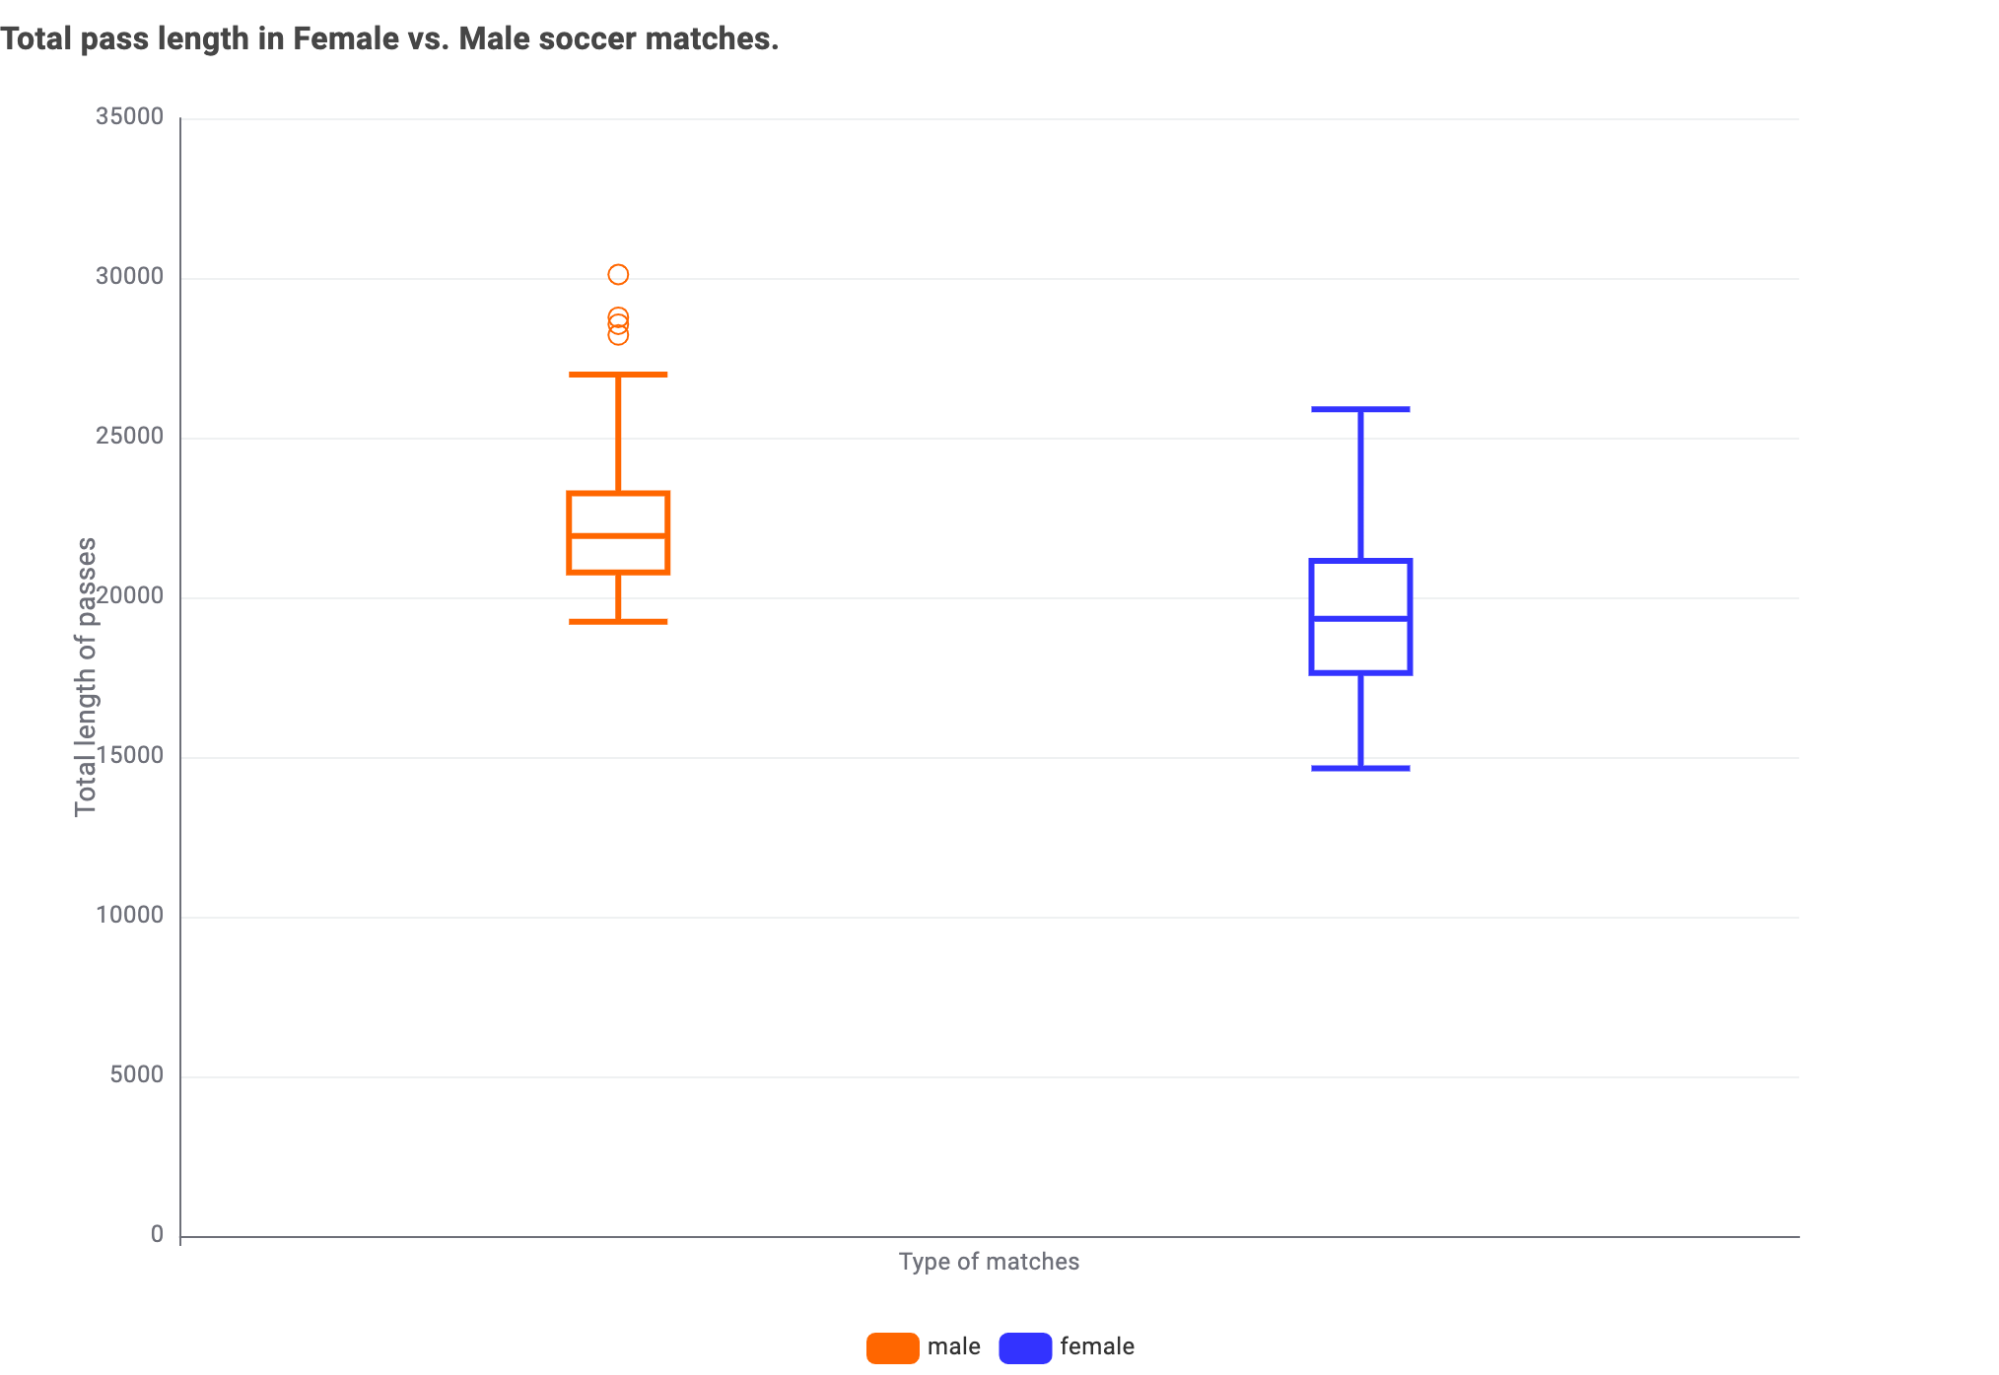
To a smaller extent, we find the sum of all pass lengths and the number of committed fouls as decisive features for the classification. Passes seem to be shorter in women’s vs men’s soccer. This might be a feature related to the level of physical training which is also strongly related to the professionalization of the sport.
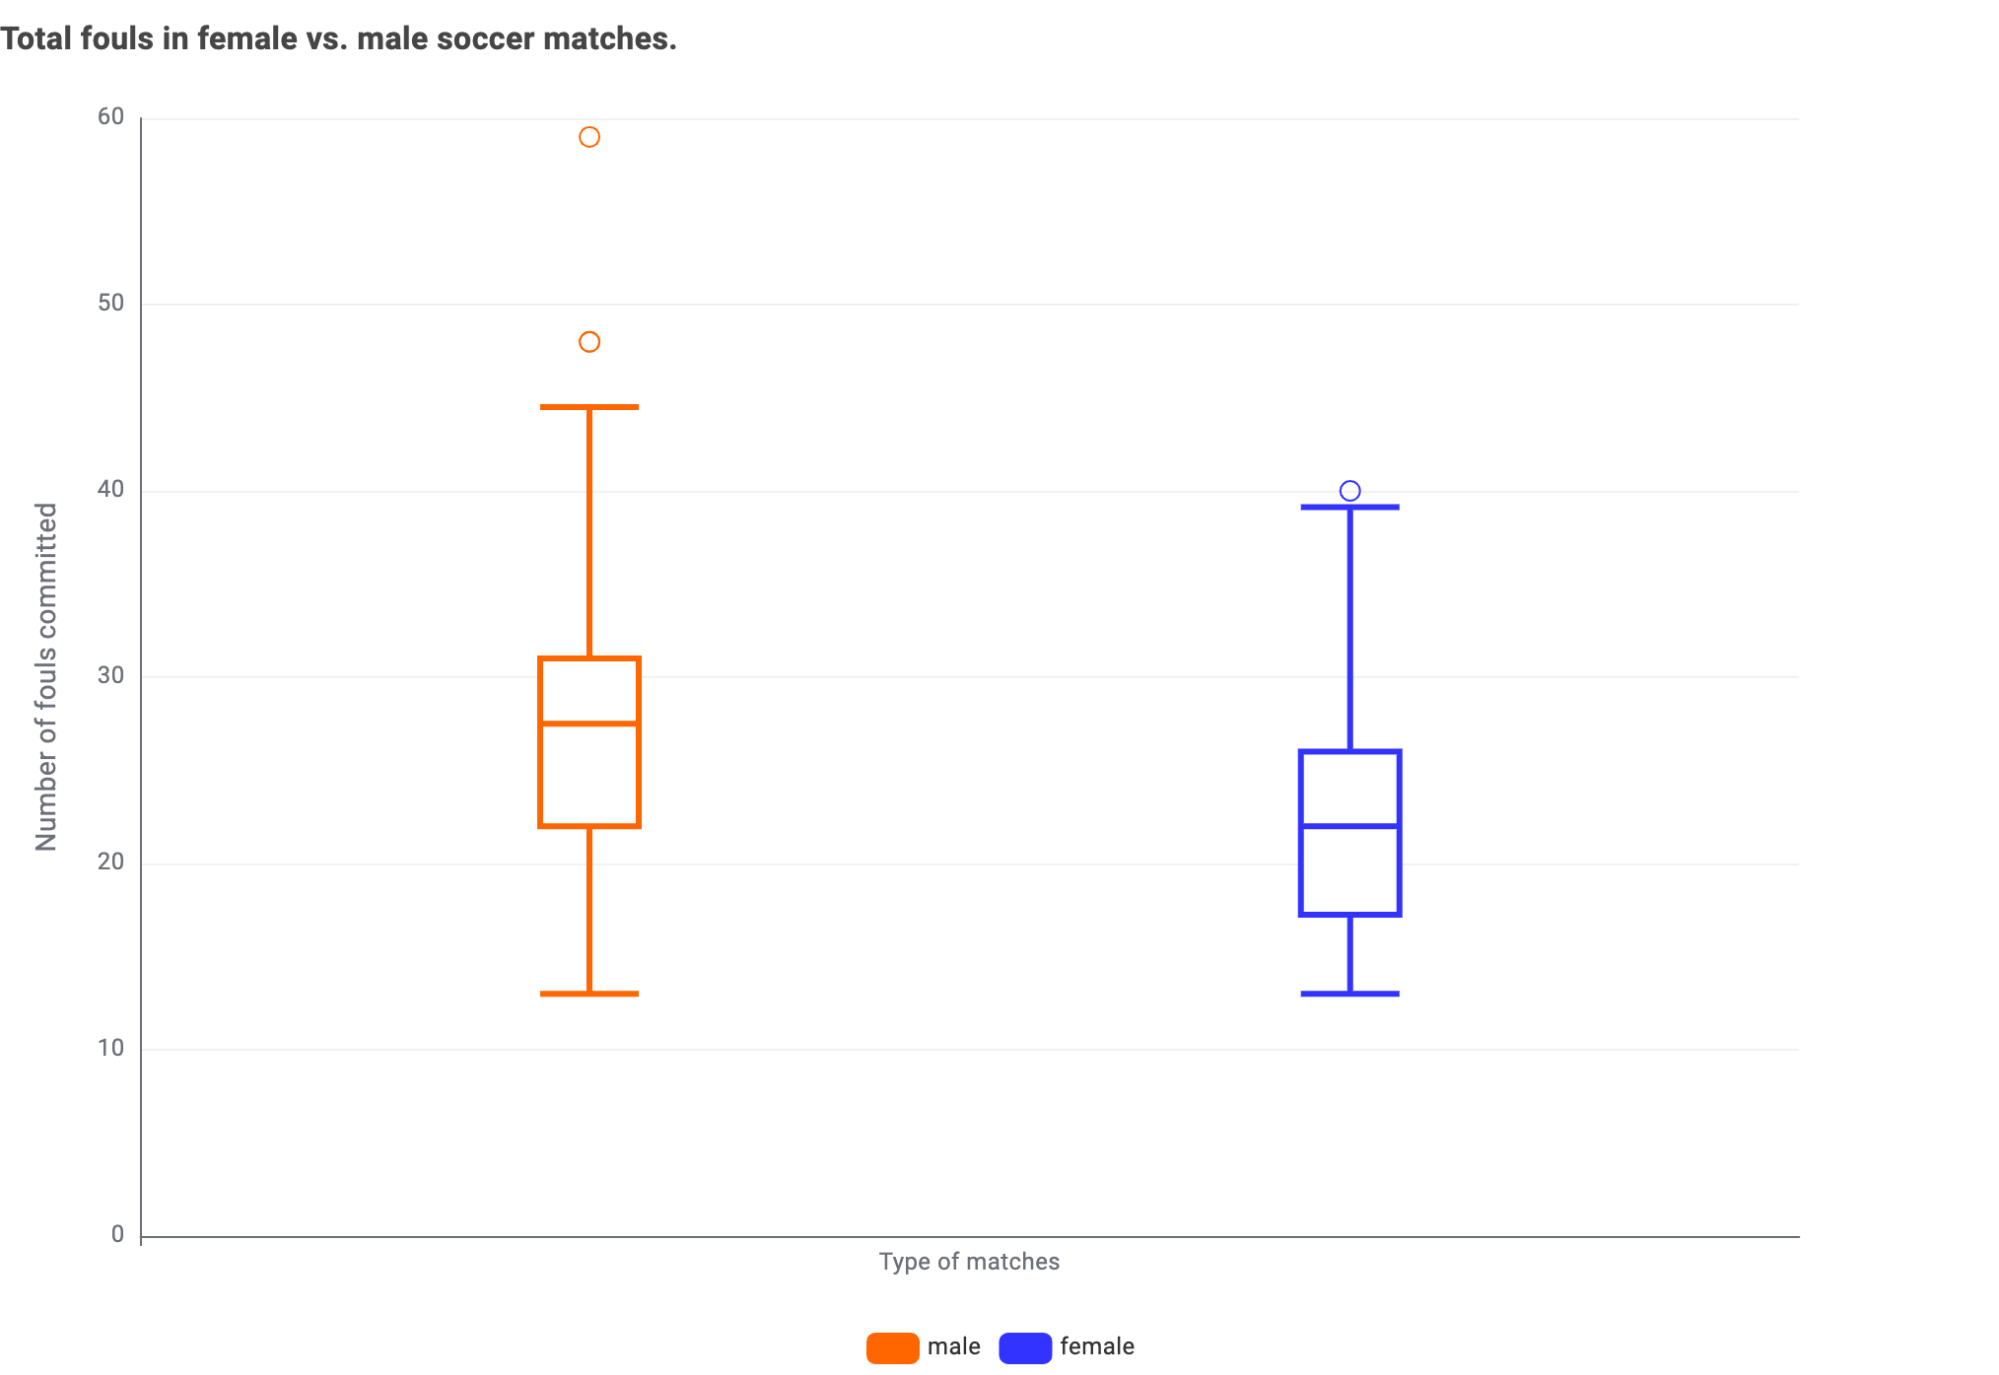
About the total number of fouls committed in a game, you can see from the following box plot, that men’s games are overall characterized by a higher level of fouls.
Least influential features
It is also interesting to examine the features that do NOT contribute to the overall distinction of men’s vs women’s soccer matches. Indeed, since I utilized a Laplace prior distribution for the logistic regression model, the model tends to effectively set the coefficients of less important features close to 0.
Again, according to my trained logistic regression models, the least influential features are:
- Number of events with actions by goalkeeper (no_goal_keeper_events)
- Number of shots per match (no_shots_per_match)
- Mode of all pass angles in a match (angle_mode)
- Number of shots with backheel technique (shots_backheel)
- Number of shots with half volley technique (shots_half_volley)
- Number of shots with overhead kick (shots_overhead_kick)
Basically there seems to be no difference (or negligible difference) between the number of shots based on specific techniques in a game. This shows that the playing style is quite similar between men and women. The pass angles and the goalkeeper role seems also to be comparable in both types of matches.
So, is women’s soccer different from men’s soccer?
Yes, after analyzing the data from the 2022 Men’s FIFA World Cup and the 2023 Women’s FIFA World Cup, we can see that women’s soccer matches are characterized by lower foul rates, higher ball recoveries, and a shorter average pass distance.
Many features of the game cannot be effectively differentiated, including goalkeeper activity, number of shots per match, the average pass angle, the number of overhead kicks, and various other metrics. This implies that there are no significant differences in many tactical and technical skills in men's and women's soccer.
If you’d like to explore this data and the workflows yourself, you can take a look at Soccer Analysis folder in Sport Analytics Space on KNIME Community Hub
Acknowledgment. This article is based on the project submission of Quynh Anh Nguyen to the Student Soccer Analytics Challenge organized by Prof. Dr. Ulrik Brandes at ETH Zürich, in collaboration with KNIME and supported by the ETH AI Center. Her project won second place in the challenge.