Rising environmental awareness and concerns over climate change have pushed institutions like the European Union to set ambitious targets: halving emissions by 2030 and achieving carbon neutrality by 2050. As a result, sectors from heating and transportation to food production are under increased pressure to reduce their environmental impact.
To meet these goals, governments and companies are increasingly focusing on carbon computing, in other words, tracking their carbon footprints. However, despite numerous international standards and guidelines, there is still no universally agreed-upon method for accurately measuring an organization’s carbon emissions.
To address this challenge, we adopted the Greenhouse Gas Protocol (GHGP), a widely recognized framework that helps organizations measure and manage CO2 emissions by categorizing them into different scopes.
In this blog post, you will learn how to:
- Estimate a company’s carbon footprint using the GHGP framework.
- Calculate and monitor CO2 emissions using KNIME Analytics Platform
- Collect emissions data across various scopes, compute total CO2 emissions
- Create an interactive dashboard to visualize carbon footprint trends over time and per employee.
This article is part of KNIME for Finance, a series of articles to show you solutions to common finance tasks related to financial planning, accounting, tax calculations, and auditing problems all implemented with the low-code KNIME Analytics Platform.
The Task: Measuring a Company’s Carbon Footprint
The Greenhouse Gas Protocol (GHGP) classifies emissions into three key scopes:
- Scope 1: Direct emissions from sources owned or controlled by the company.
- Scope 2: Indirect emissions from the company’s consumption of purchased energy.
- Scope 3: Indirect emissions from the company’s entire value chain, including purchased goods, business travel, and employee commuting.
Since almost every aspect of a company’s operation produces emissions, these scopes are further divided into more detailed categories to provide a comprehensive assessment of the overall carbon footprint.
The Data
It's important to recognize that a company’s activities directly influence the types of emissions that need to be accounted for. For example, the emission sources for a hotel will differ from those of a software company, resulting in different inputs for the carbon footprint calculation.
In this use case, we focus on a medium-sized software company. To capture its emissions accurately, we've identified relevant sources such as energy consumption and HVAC usage, employee commuting and office attendance, as well as advertising and marketing research activities.
The datasets used in the workflows are synthetically generated to reflect the real-world operations of this type of company. Let’s examine how each dataset was created, including the specific activities covered, the methods of data generation, granularity, and units of measurement.
Energy consumption and HVAC usage
Activity: This dataset includes all energy consumed within the office buildings, including electricity for devices and Heating, Ventilation, and Air Conditioning (HVAC) systems.
Data Generation: To create a realistic dataset for energy consumption and HVAC usage, we first researched typical energy profiles for a medium-sized software company. We used the Commercial Energy Calculator from Union Power Cooperative to simulate this data. The calculator allows us to input facility profile information and generates a report of estimated annual energy consumption and costs.
Granularity and Measurement: The dataset follows a normal distribution and reports daily energy usage in kilowatt-hours (kWh) for a full year.

Employee Commute and Attendance
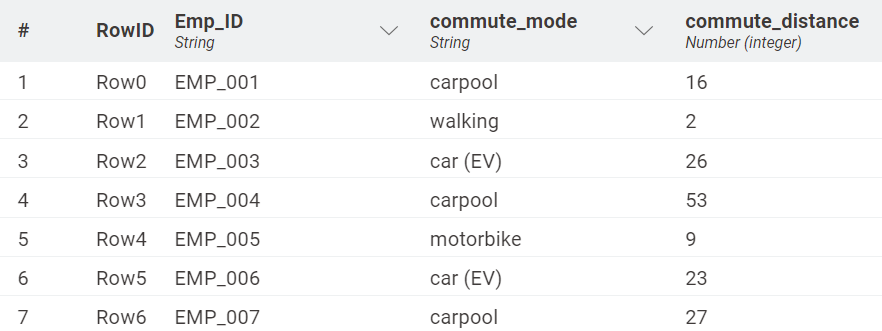
Activity: These datasets track employee attendance at the office and provide details about their commuting, including modes of transport and distance traveled.
Data Generation: To simulate this data, we conducted a preliminary survey with a small group of KNIME employees to gather information on their commuting methods, frequency of office attendance, and travel distances. We used these inputs to generate two datasets:
- Dataset 1: Reports commuting modes (e.g., car, motorbike, walking) and corresponding distances in kilometers.
- Dataset 2: Details daily attendance records, reflecting the company’s flexible remote work policy.
Granularity and Measurement: The datasets include commuting modes (car, motorbike, walk, etc.) and distances (km), as well as daily attendance in the office.

Advertising and Marketing Research
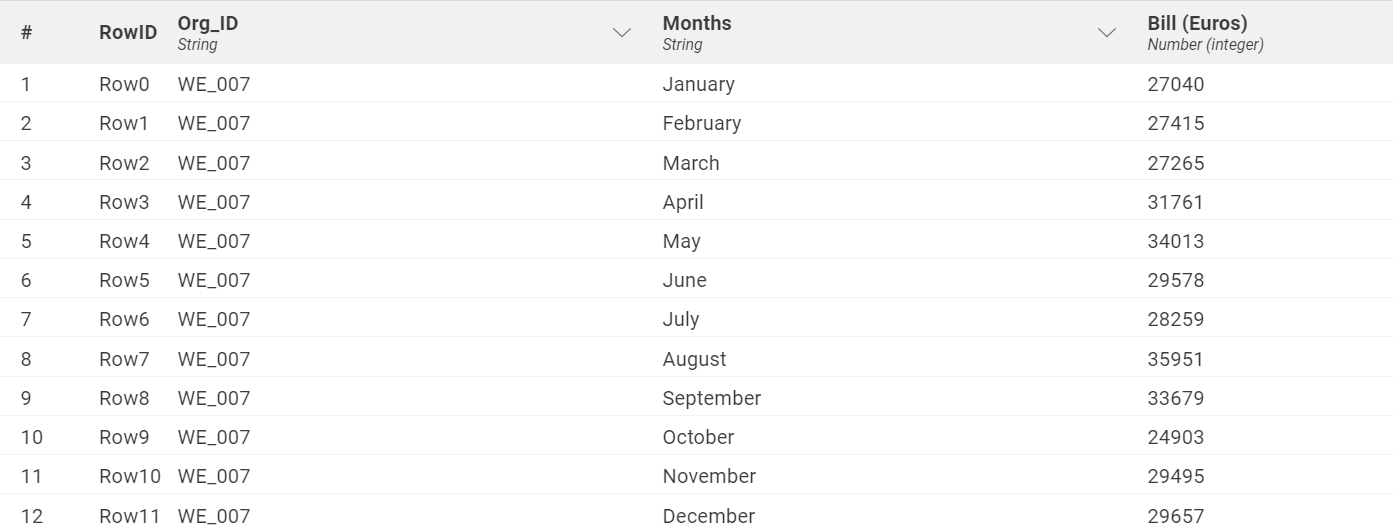
Activity: This category accounts for the advertising and marketing research conducted by the company, including costs for external services. For this example, the fictional software company relies on third-party agencies to manage comprehensive marketing campaigns. This involves outsourcing tasks such as market research, digital advertising, and promotional activities. While the company doesn’t perform these tasks directly, the expenditures for these external services contribute to its overall carbon footprint.
Data Generation: To create this dataset, we estimated the monthly spending on various marketing and research activities typical for a medium-sized software company. We took the estimated annual revenue of companies with this size and then followed benchmark calculations for marketing expenditure.
Granularity and Measurement: The dataset includes monthly entries for marketing expenses, with costs reported in Euros.
Strategies to compute CO2 emissions
Calculating CO2 emissions isn't always straightforward. Companies typically rely on data such as electricity consumption, kilometers (travel), or expenses (in local currency) and then apply coefficients from established sources to estimate the CO2 produced by that activity.
Let’s consider a simple example, using the coefficients proposed by the UK government in the Greenhouse Gas Reporting: Conversion Factors for 2023. The general formula to calculate CO2 emissions is:
CO2 Emissions (kg)=Activity Data × CO2 Emission Coefficient
When using activity data, such as the number of kilowatt-hours (kWh) consumed or kilometers traveled, the emissions can be calculated based on the relevant coefficient. For instance, walking as a commuting activity doesn’t produce CO2, so the emission coefficient is 0. In this scenario, CO2 emissions are calculated as follows:
CO2 Emissions=0 (kg/km) × Distance Walked (km)=0 kg
On the other hand, if you drive a car for 100 kilometers and the emission coefficient is 0.203 kg of CO2 per kilometer, the calculation would be:
CO2 Emissions=0.203(kg/km) × 100 km =20.3 kg
When the CO2 coefficients for an activity aren’t readily available, or the resource consumption of that activity is hard to quantify, a fair approximation of CO2 emissions can be obtained using financial data and estimated emission factors. This means employing conversion tables that allow you to compute CO2 emissions based only on the monetary cost of a given activity. The estimated CO2 coefficients we used stem from the academic research conducted by Prof. Dr. Erdal Yalcin from the University of Applied Sciences in Konstanz.
Suppose we spend €27,000 on a marketing campaign. We apply the same formula as above:
CO2 Emissions (kg)=Cost of Activity × CO2 Emission Coefficient
The estimated conversion factor by Prof. Yalcin for this specific type of activity is 0.07037 (kg/€) so the equation would look like:
CO2 Emissions=0.07037 (kg/€) × 27,000€=1,890 kg
The Workflow: Compute and visualize CO2 emissions
The workflow used in this article is available publicly and free to download on the KNIME Community Hub. You can find the workflows on the KNIME for Finance space under CO2 Emissions.
The CO2 Emission Tracker workflow consists of three main sections, each corresponding to the company's main activities:
- Energy Consumption and HVAC Usage
- Employee Commute and Attendance
- Advertising and Marketing Research.
For each activity, CO2 emissions are computed and scopes are assigned. Lastly, insights are presented in an interactive dashboard that features charts and plots on different dimensions.
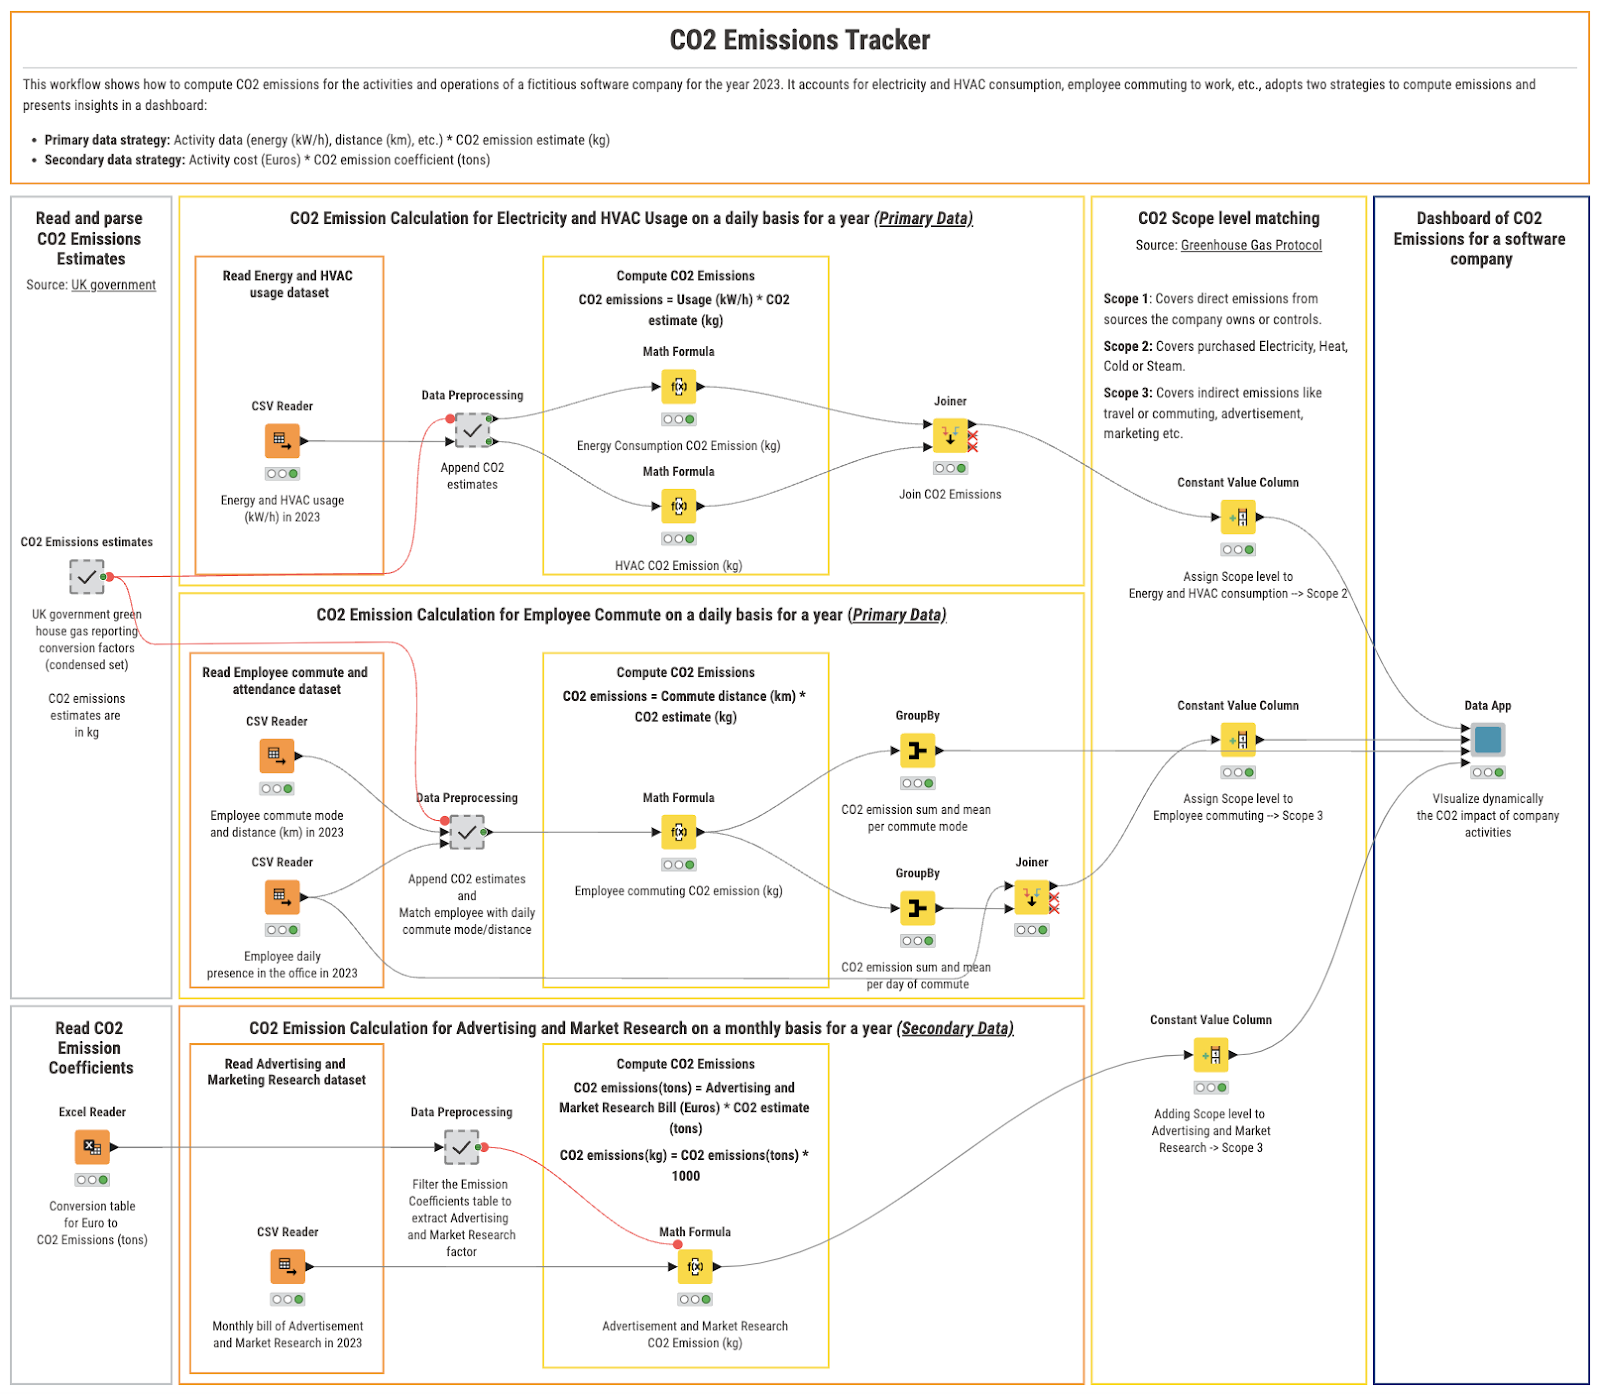
Read CO2 emission conversion factors
We start by accessing and parsing CO2 emissions conversion factors:
- CO2 emission estimates from the Greenhouse Gas Reporting for 2023 from the UK government
- CO2 emission coefficients estimated by Prof. Dr. Erdal Yalcin from the University of Applied Sciences in Konstanz.

Compute CO2 emissions
Energy and HVAC Consumption
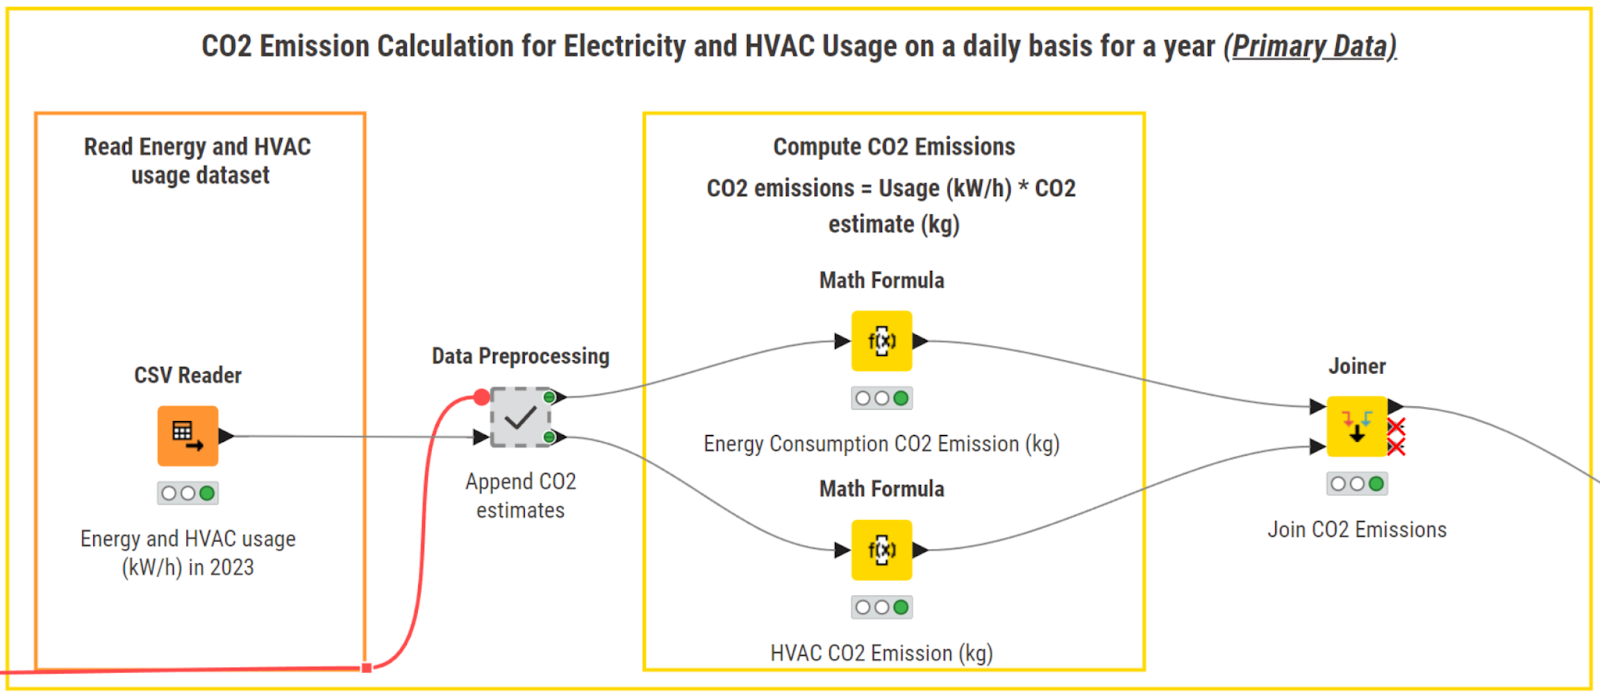
Next, we read the Energy and HVAC consumption dataset. In the “Data Preprocessing” meta node, we match the CO2 emissions estimates for electricity and HVAC with the corresponding activity.
Using the Math Formula node, we compute the total CO2 emissions (kg) by multiplying the estimates with usage data. We perform the computations for Energy consumption and HVAC usage in parallel and join the resulting tables back together.
Compute CO2 emissions for Employee Commute
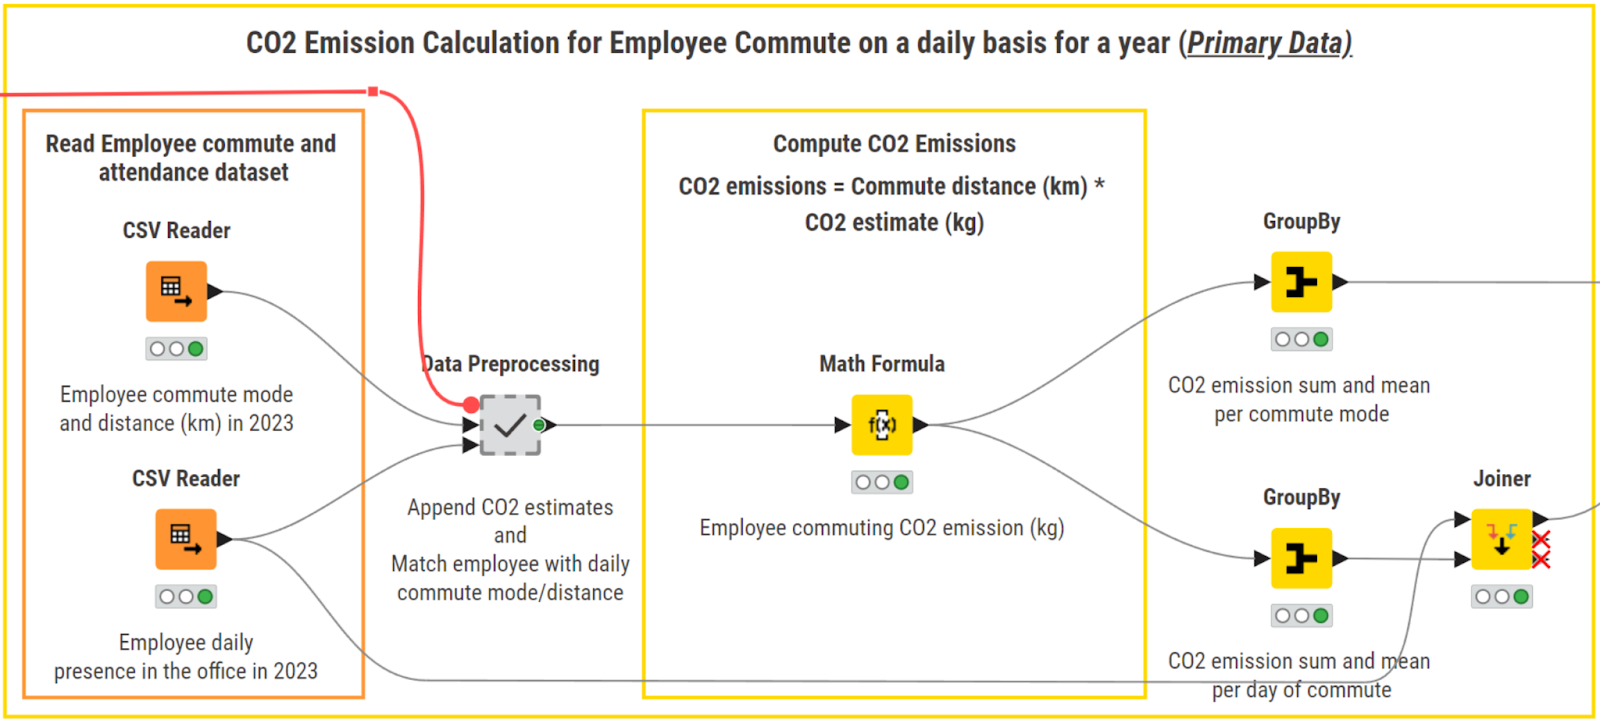
We then read the Employee Commute and Attendance datasets. In the “Data Preprocessing” meta node, we first perform a cross-join to get a daily granularity of the employees present in the office. Next, for every employee who is present in the office on a certain day, we match their commute mode with appropriate CO2 emissions estimates for means of transportation.
With the Math Formula node, we multiply the estimates with the distance commuted based on the commute mode. The output represents daily CO2 emissions (kg) for each employee. We then aggregate results to compute total and average emissions based on commute mode and day of commute.
Advertising and Marketing Research
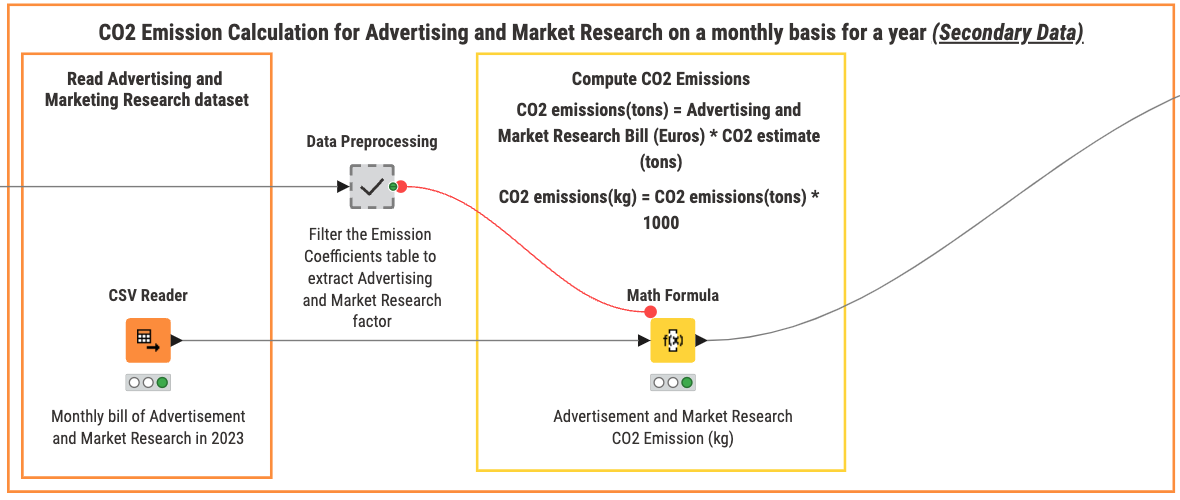
Lastly, we access the Advertisement and Market Research datasets, and the CO2 emission coefficients designed by Professor Yalcin.
We compute CO2 emissions for Advertisement and Market Research by multiplying monthly billing amounts with coefficient factors for direct & indirect emissions. We then multiply the results by 1000 to convert the emissions from tons to kg.
Assign Scopes to emissions & Build a dashboard
Once we calculate the emissions for all data sources, we can categorize them by assigning one of the three scopes defined by the Greenhouse Gas Protocol.
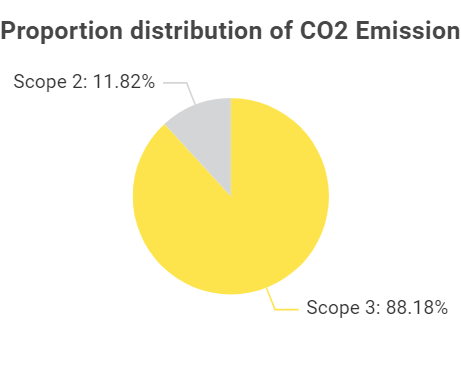
We assign Energy Consumption and HVAC to Scope 2, Employee Commute, and Advertising and Market Research to Scope 3.
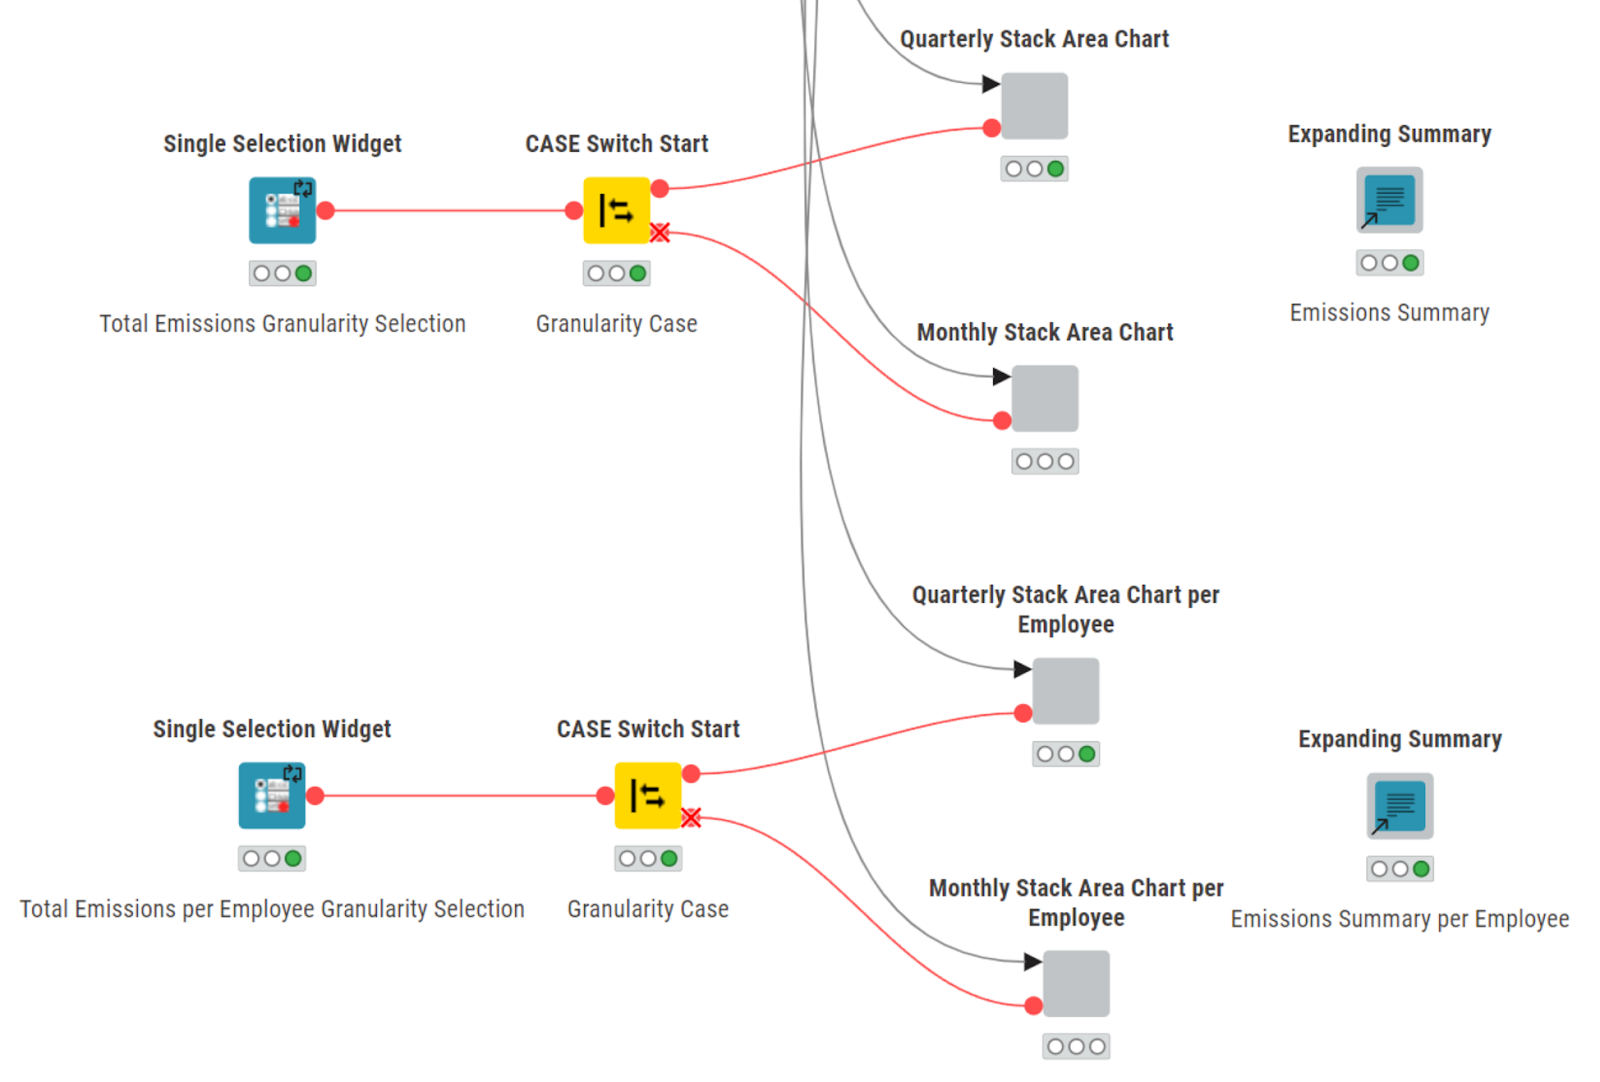
Finally, we bring together all the output tables from different subsections of the workflow to create an interactive dashboard.
We include custom plots and charts, orchestrate different filtering and granularity options, and provide micro-documentation to help the end-user understand and explore absolute and relative CO2 emissions for different dimensions.
Results: High Levels of CO2 Emissions in August
The interactive dashboard we developed at the end of this workflow provides valuable insights into the company’s carbon footprint.

The top part of the data app showcases the total annual emissions, the average emission per day, and the average emission per employee
It reveals that each employee contributes an average of 461.9 kg of CO2 annually. The primary source of CO2 emissions within our company is "Advertising and Marketing", followed by "Employee Commute."

The pie chart gives insights into the distribution of scopes. In the case of our fictitious software company, scope 3 accounts for 88.18% of total emissions.
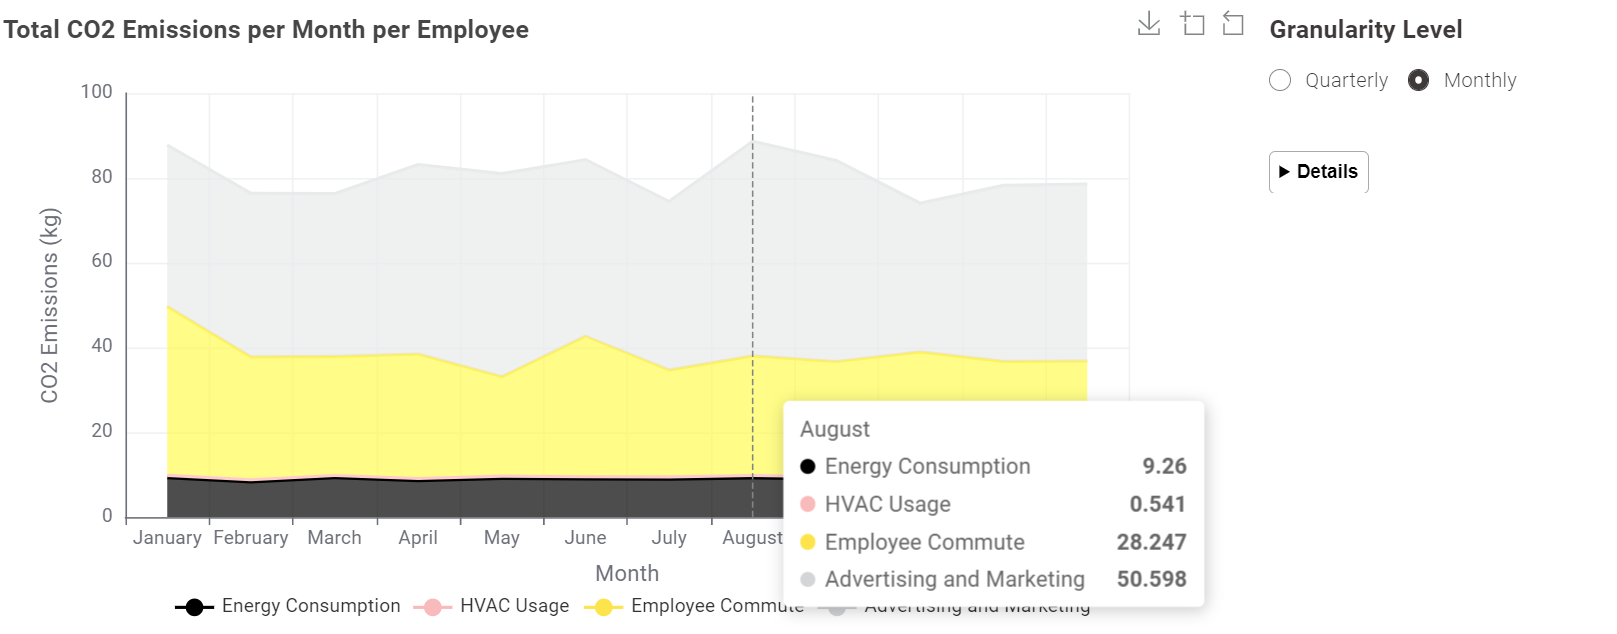
The stacked area chart illustrates total CO2 emissions from various sources monthly, helping us identify trends over time. From this graph, we observe that August recorded the highest level of CO2 emissions.
KNIME for Finance
Using KNIME Analytics Platform, we have integrated multiple data sources and created a visualization dashboard on carbon emissions. Feel free to check out and download this workflow for free from the KNIME Community Hub.
Try it yourself and visualize your CO2 emissions over different time periods using the appropriate data to gain valuable insights and perspective.
