Verified Components History
The Verified Component project developed, verified and released components on a monthly basis between 2019 and 2023. You can find the previous releases with example workflows and references listed below. While these components still offer bundled functionality, that is guranteed by KNIME backwards compatibility, they are no more actively maintained by the KNIME team. If you spot any issues or have any feedback please report it to us in this KNIME Forum thread.
June 2023

Topic Explorer View
This component generates a view to visualize the output of a topic model. You can use it to browse topics, their terms, semantic/exclusivity scores and documents. It can be deployed as a data app on KNIME Business Hub or KNIME Server. To see how to combine it with other nodes and verified components check the Topic Modeling space.
View Component | View Workflow
Category: Visualizations
Authors: Francesco Tuscolano, Application Engineer at KNIME and Paolo Tamagnini, Senior Data Scientist at KNIME
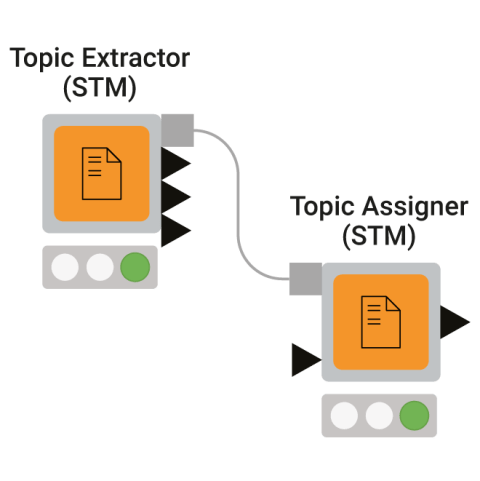
Topic Extractor and Assigner (STM)
These two twin components can be adopted to train and test a Structural Topic Model (STM) via the KNIME Interactive R Statistics Integration. The component adopts the KNIME Conda Integration to automatically install the environment on the first component execution. To see how to combine it with other nodes and verified components check the Topic Modeling space.
View Extractor Component | View Assigner Component | View Workflow
Category: Text Processing
Authors: Paolo Tamagnini, Senior Data Scientist at KNIME and Francisco Villaroel, Assistant Professor of Marketing at LUISS Guido Carli University

Topic Scorer (Labs)
This component is designed for scoring topics at the output of a topic model. The experimental component measures semantic coherence, exclusivity and neighbor distances of one or multiple models. The component is part of KNIME Labs as it is an experimental implementation. To see how to combine it with other nodes and verified components check the Topic Modeling space.
View Component | View Workflow
Category: Text Processing
Authors: Angus Veitch, Data Analytics Consultant at Forest Grove, Francesco Tuscolano, Application Engineer at KNIME and Paolo Tamagnini, Senior Data Scientist at KNIME
February 2023

Alphafold Database Search
This component is based on the AlphaFold Protein Structure Database. The Alphafold AI system predicts a protein's 3D structure from its amino acid sequence. The component uses an existing already trained version of Alphafold to predict the 3D structure.
View Component | View Workflow
Category: Life Sciences
Author: Franziska Rau, Data Science Intern at KNIME

Tox Alert Skin Sensitization
This component flags input molecules upon their skin sensitization potential. The SMARTS expressions, which encode the potential reactive site and the domain/mechanism, are based on the paper from Enoch et al. 2008. Substructure filtering and highlighting of reaction sites are performed by the RDKit Nodes Feature community extension.
View Component | View Workflow
Category: Life Sciences
Author: Alice Krebs, Life Sciences Solution Engineer at KNIME
December 2022

Financial Analysis Category
Five new components can cover the following finance functions: NPV, XNPV, IRR, XIRR and MIRR. Adopt these components to automate spreadsheet operations to track total value, profitability and attractiveness of one or more investment projects with periodic or non-periodic transactions. These components were developed by finance analytics experts at Mydral, formerly nominated KNIME Partner of the Year 2022.
Category: Financial Analysis
Author: Cristian Rastasanu, Data Analyst at Mydral and Mathieu Rondeau, Head of Marketing & Innovation at Mydral
November 2022
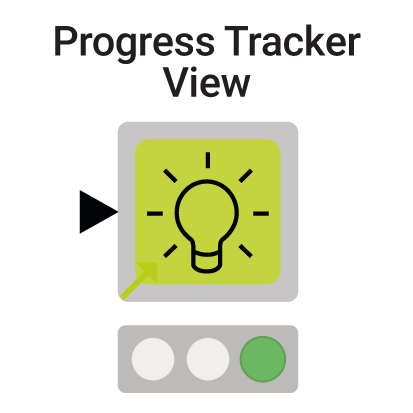
Progress Tracker View
This component visualizes a flowchart for the current progress/status of an interactively selected process. This is useful when the number of steps in the process is known. This visual can be particularly useful when tracking the deliveries in a supply chain logistics problem, but it can work in any domain. Discover the data app example for this component: interact in a live demo on our public community server and/or inspect the underlying workflow.
Category: Guided Analytics
Author: Kyle Watkins, Solutions Engineer at KNIME and Paolo Tamagnini, Senior Data Scientist at KNIME
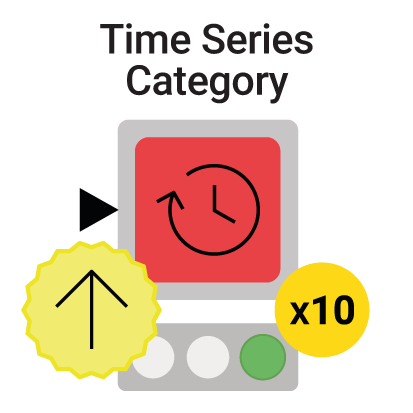
Time Series Category (Updated!)
10 components from the Time Series category, also referenced in the Codeless Time Series Analysis book and space, have been updated to use the new Python bundled environment. Now you can adopt SARIMA/ARIMA, Fast Fourier Transform (FFT), and other techniques without having to manually configure any Python or Conda preferences. Drag, drop, configure and execute your time series analysis based on low code Python scripts!
Category: Time Series
Author: Corey Weisinger, Senior Data Scientist at KNIME
October 2022
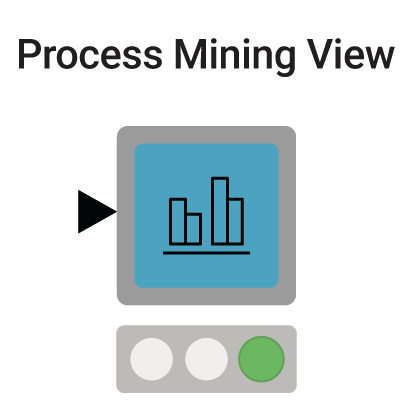
Process Mining View
This component is designed to visualize in a flow chart and filter processes. Process mining is a set of techniques adopted to analyze event logs, that is files storing data of the processes and operations happening internally or externally to an organization. Check the data app example featuring the component on procurement data. Besides this component the KNIME Hub also offers nodes from Process Mining Community Extension.
Category: Visualizations
Author: Ahmad Varasteh, Data Science Intern at KNIME and Paolo Tamagnini, Senior Data Scientist at KNIME
August 2022
Small Multiples View
This component adopts the Plotly JavaScript library to visualize small multiples, that is a series of identical charts on different partitions of data. Adopt this technique when visually detecting groups of outliers or simply compare trends in different groups of data points.
View Component | View Workflow
Category: Visualizations
Author: Ahmad Varasteh, Data Science Intern at KNIME
July 2022
Synthetic Data Generators
These 4 new components can be adopted to generate data to test either a classification, regression, clustering or multilabel scenario. All components automatically install scikit-learn via the KNIME Python Integration and a few KNIME AP Preferences for Anaconda.
View Component | View Workflow
Category: Data Manipulation
Author: Franciska Rau, Data Science Intern at KNIME
June 2022

Parameter Optimization (Table)
This component performs a (hyper)parameter optimization for any classification model provided at its input given a few settings such as cross validation. To get hands-on examples on the component and the nodes inside check the Parameter Optimization for Classification space.
View Component | View Workflow
Category: Automation
Author: Keerthan Shetty, Data Science Intern at KNIME and Paolo Tamagnini, Data Scientist at KNIME
May 2022
REOS Tagger
This component is designed to tag input molecules for violations of the REOS (Rapid Elimination of Swill) rules. Optionally it also checks for structural alerts. For this, several different rule sets are available.
View Component | View Workflow
Category: Life Sciences
Author: Alice Krebs, Life Science Data Scientist at KNIME and Greg Landrum, External Advisor at KNIME
April 2022
Choropleth Map
This component uses Google GeoCharts to visualize a choropleth map, that is a geographical map divided in areas, colored with different color intensity. Similarly to the Heatmap node, the color intensity represents a numeric column provided at the input. Unlike the previously published Choropleth World Map verified component, it is able to visualize both countries and provinces in different world continents and regions
View Component | View Workflow
Category: Visualizations
Author: Ahmad Varasteh, Data Science Intern at KNIME
Dot Map
This component uses Google GeoCharts to visualize a dot map, that is a geographical map with markers colored with different size and color intensity. Similarly to the Bubble Chart node, the color intensity and size represent a different numeric column provided at the input. The component is able to visualize latitude and longitude coordinates in different world continents and regions.
View Component | View Workflow
Category: Visualizations
Author: Ahmad Varasteh, Data Science Intern at KNIME
March 2022
Model Simulation View
The component generates a view that allows for model re-execution upon user input. This view can be adopted for machine learning testing or deployment purposes. Access the interactive view either locally, on KNIME Analytics Platform, or online in a data app deployed on KNIME Server via the KNIME WebPortal.
View Component | View Workflow
Category: Visualizations
Author: Paolo Tamagnini, Data Scientist at KNIME
February 2022

Fairness Scorer
This component computes fairness metrics over an input classification model adopting the following metrics: demographic parity, equality of opportunity and equalized odds. Use this component to flag models that might unfairly impact stakeholders following basic responsible AI principles.
View Component | View Workflow
Category: Model Interpretability
Author: Mahantesh Pattadkal, Data Science Intern at KNIME and Paolo Tamagnini, Data Scientist at KNIME
January 2022
AutoML (Regression)
Automatically trains supervised machine learning models for a regression task. It's able to automate the whole ML cycle by performing some data preparation, parameter optimization with cross validation, scoring, evaluation and selection. It also captures the entire end-to-end process and outputs a workflow port object using the KNIME Integrated Deployment Extension. To automatically train models for a classification task, check instead its twin version: the AutoML component.
View Component | View Workflow
Category: Automation
Author: Lada Rudnitckaia, Junior Data Scientist at KNIME and Paolo Tamagnini, Data Scientist at KNIME
Auto-SARIMA
This component uses a heuristic approach to analyze the target series and fit a (S)ARIMA model for forecasting with automatically configured hyper-parameters. Auto-SARIMA stands for Automated Seasonal Autoregressive Integrated Moving Average: an automated training of a SARIMA model.
View Component | View Workflow
Category: Time Series
Author: Corey Weisinger, Data Scientist at KNIME
December 2021
Measure Fractional Years
This component is designed to measure time passed between two dates in a financial year. Similarly to the YEARFRAC function on Microsoft Excel, the user can select from 3 different ways of calculating the fractional years.
View Component | View Workflow
Category: Finance Analytics
Author: Ana Vedoveli, Solution Engineer at KNIME
Invert Category Sign
This component is designed to invert signs of numerical columns only for the rows belonging to the selected categories. There are many use cases for this component. For example computing conditional totals or aggregations in finance teams.
View Component | View Workflow
Category: Data Manipulation
Author: Ana Vedoveli, Solution Engineer at KNIME
Conditional Density Plot
This visualization can be used to explore the relationship between a numerical column and a categorical column. For each category in the categorical column, a density curve for the distribution of the partitioned numerical column is displayed. The stronger the relationship, the more distinctive the different curves are.
View Component | View Workflow
Category: Visualizations
Author: Lukas Siedentop, Solution Engineer at KNIME
November 2021

Data App Header
This component allows you to design a header for your data app. The header can include your custom logo, text and colors that are appropriate for your brand and context. It'll appear in the composite view within KNIME Analytics Platform, as well as any data app that has been deployed via KNIME Server.
View Component | View Workflow
Category: Guided Analytics
Author: Janina Mothes, Life Science Data Scientist at KNIME
Data App Flowchart
Once you deploy one or more connected components as a data app, the end user interacts with the front end without necessarily knowing anything about the underlying workflow. Nest the new Data App Flowchart within the deployed data app to provide a visual graphic that illustrates the sequential steps the user must take.
View Component | View Workflow
Category: Guided Analytics
Author: Paolo Tamagnini, Data Scientist at KNIME
October 2021
Animated Bar Chart
This component visualizes in a bar chart values increasing or decreasing over time. Each visual bar represents a different category, racing in range with the others in a smooth animation. The component uses a Generic JavaScript View node where the visualization is implemented via the D3.js library.
View Component | View Workflow
Category: Visualizations
Author: Paolo Tamagnini, Data Scientist at KNIME
Synthetic Data Generator (Numeric)
This component is designed for generating data from an existing numeric column, for example, to anonymize or increase the size of the training data. The data generation is based on the approximation of the distribution of the original column. The distribution can also be approximated separately for sub-groups in the data to maintain known dependencies between columns. Use its twin version “Synthetic Data Generator (Nominal)” to generate nominal columns instead.
View Component | View Workflow
Category: Data Manipulation
Author: Maarit Widmann, Data Scientist at KNIME
Synthetic Data Generator (Nominal)
This component is designed for generating data from an existing nominal column, for example, to anonymize or increase the size of the training data. The data generation is based on the frequency distribution of the nominal values in the original column. The frequency distribution can be calculated separately for sub-groups in the data to maintain known dependencies between columns. Use its twin version “Synthetic Data Generator (Numeric)” to generate numeric columns instead.
View Component | View Workflow
Category: Data Manipulation
Author: Maarit Widmann, Data Scientist at KNIME
September 2021
Keyword Search
This component extracts the most relevant English keywords in a corpus (a collection of documents) using three specific techniques: Topic Extraction using LDA, Term Co-Occurrence, Max(TF-IDF) measure. The component can be used also to extract keywords in other languages by adopting beforehand nodes from the KNIME Text Processing and Language Packs extensions.
View Component | View Workflow
Category: Text Processing
Author: Ali Asghar Marvi, Data Scientist Intern at KNIME and Paolo Tamagnini, Data Scientist at KNIME
Web Text Scraper
This component uses a Java based library called BoilerPipe to detect and remove boilerplate text from a web page and only extract the main textual content. This component can be used to analyze online trends and Search Engine Optimization (SEO)by connecting the output with the Keyword Search component, and the input with the Twitter URLs Extractor or the Google URLs Extractor components.
View Component | View Workflow
Category: Text Processing
Author: Ali Asghar Marvi, Data Scientist Intern at KNIME and Paolo Tamagnini, Data Scientist at KNIME
Twitter URLs Extractor
This component is designed for querying tweets via the KNIME Twitter Connectors extension and collecting all the URLs within the text message of each tweet. To discover which are the trends of the linked web pages on Twitter, you can analyze the output via the Web Text Scraper component or other nodes from the KNIME Text Processing extension.
View Component | View Workflow
Category: Automation
Author: Ali Asghar Marvi, Data Scientist Intern at KNIME and Paolo Tamagnini, Data Scientist at KNIME

Google URLs Extractor
This component is designed for querying Google results and collecting all the associated URLs via the Google Custom Search API. To discover which are the trends of the web pages in the search results in Google, you can analyze the output via the Web Text Scraper component or other nodes from the KNIME Text Processing extension.
View Component | View Workflow
Category: Automation
Author: Ali Asghar Marvi, Data Scientist Intern at KNIME and Paolo Tamagnini, Data Scientist at KNIME
August 2021
Forecast Horizon
This component analyzes the quality of a forecast by visualizing different error metrics as the forecast length increases. Use this component to understand how far into the future a model’s forecasts remain reliable.
View Component | View Workflow
Category: Time Series
Author: Corey Weisinger
Python Transform (Load)
This Component loads the pickled object that is created by the Verified Component Python Transform and saved via the Python Object Writer node. The output pickled object can be provided to the input of the Verified Component Python Transform (Apply) to apply the same transformations in a new workflow.
View Component | View Workflow
Category: Data Manipulation
Author: Mahantesh Pattadkal
AutoML (Updated!)
This Component automatically trains supervised machine learning models for both binary and multiclass classification. The Component, initially published in August 2020, has been updated by replacing deprecated nodes and also by adding new ML nodes like the new H2O AutoML Learner. This Component can be used in combination with other Verified Components using the KNIME Integrated Deployment Extension.
View Component | View Workflow
Category: Automation
Author: Paolo Tamagnini and Mahantesh Pattadkal
July 2021
News API Sources
This component can be used to get detailed information about sources from the News API and map articles from other News API components to the source list. It requires a valid API Key to be able to connect and download results.
View Component | View Workflow
Category: Text Processing
Author: SJ Porter
News API Headlines
This component can be used for finding articles related to a specific topic, company, or combination of search terms. The results can be used for text analysis models, business applications, and web scraping projects. The component requires a valid API Key from News API to be able to connect and download results.
View Component | View Workflow
Category: Text Processing
Author: SJ Porter
News API Advanced Search
This component, just like the News API Headlines component, is designed for collecting news search results retrieved from News API, but offers additional settings to perform an advanced search. The component requires a valid API Key to be able to connect and download results.
View Component | View Workflow
Category: Text Processing
Author: SJ Porter
June 2021

SARIMA Learner
This component allows the user to train a SARIMA (Seasonal ARIMA) model with varying parameters. This type of time series model is more robust than its ARIMA counterpart and is a powerful option when designing forecasts or performing other Time Series Analysis on data with seasonal or cyclic patterns.
View Component | View Workflow
Category: Time Series
Author: Corey Weisinger

SARIMA Predictor
This component works in conjunction with the SARIMA Learner to generate forecasts based on the learned model. Simply plug in the SARIMA Learner component and select the number of forecasts to generate.
View Component | View Workflow
Category: Time Series
Author: Corey Weisinger
Python Transform
This simple data transformation, already provided by the Normalizer node and other nodes, was re-implemented via the KNIME Python Integration and stored in this Component in a reliable and reusable way. Use this component to learn how to embed your Python script in a Component for other KNIME users.
View Component | View Workflow
Category: Data Manipulation
Author: Mahantesh Pattadkal
Python Transform (Apply)
This component can be used in combination with the other Python Transform component to apply the same data transformation on more data via an input Python object. This strategy comes in handy when deploying the Python script on KNIME Server or when simply transforming the test set partition based on the data distribution in the train partition.
View Component | View Workflow
Category: Data Manipulation
Author: Mahantesh Pattadkal
May 2021

Global Feature Importance
This component computes global feature importance for the provided black-box model and visualizes it via an Interactive View. Feature importance can be computed with four available model-agnostic techniques: three global surrogate models as well as the permutation feature importance. The input model has to be trained in KNIME and captured as a Workflow Object via the KNIME Integrated Deployment Extension.
View Component | View Workflow
Category: Model Interpretability
Author: Lada Rudnitckaia and Paolo Tamagnini

Counterfactual Explanations (Python)
This component generates intuitive and local explanations for each prediction from a binary classification model trained either using the KNIME Deep Learning - Keras Integration or the KNIME Python Integration. To compute the explanation the Python package “alibi” is adopted via a Conda Propagation node.
View Component | View Workflow
Category: Model Interpretability
Author: Mahantesh Pattadkal and Paolo Tamagnini
Local Explanation View
This component generates an interactive visualization to help the user understand their model’s behavior around an individual data point. It works in two main steps. First by finding nearby counterfactual data points. Then by training a GLM to mimic the input model and provide feature importance values. The component works with any binary or multiclass classifier correctly captured with the KNIME Integrated Deployment Extension.
View Component | View Workflow
Category: Model Interpretability
Author: Corey Weisinger
March 2021
Overdue Invoices Status
This component is designed for automated control of overdue invoices. Based on the invoice issue date and payment terms, it calculates the due date, number of days until the due date, and the due status.
View Component | View Workflow
Category: Finance Analysis
Author: Lada Rudnitckaia and Felix Kergl-Räpple

Overdue Invoices Email Notification
This component is designed for automated reporting of overdue invoices. It automatically sends emails to managers about invoices that require some particular action.
View Component | View Workflow
Category: Finance Analysis
Author: Lada Rudnitckaia and Felix Kergl-Räpple
Categories to Excel Sheets
This component creates an Excel file and writes the input table to the separate sheets of this file so that each sheet contains a subset of the table as defined by the categories in a selected column.
View Component | View Workflow
Category: Finance Analysis
Author: Lada Rudnitckaia and Felix Kergl-Räpple
February 2021
Model Monitor View
Once a single classifier model is trained and deployed on KNIME Server it can be monitored from the KNIME WebPortal with this component. When the model, captured with Integrated Deployment, is provided together with past deployment data the component generates a chart with performance over time and a button to trigger the re-training of the model.
View Component | View Workflow
Category: Guided Analytics
Author: Mahantesh Pattadkal and Corey Weisinger
Model Monitor View (Compare)
Similar to its twin component “Model Monitor View”, the “Compare” variant can monitor the deployment performance for a classification task from the KNIME WebPortal. The main difference relies on comparing two models' performances over time instead of a single one. This is usually necessary when comparing the original model and its retrained version. A button is available to trigger the deployment of the new model and replace one that is currently deployed.
View Component | View Workflow
Category: Guided Analytics
Author: Mahantesh Pattadkal and Corey Weisinger
3D Molecule Viewer
Visualizes molecular data using the JavaScript library 3Dmol.js. The component visualizes data types PDB, SDF, or Molfile and also provides an option to select different atom styles. Additionally, the 3D Molecule Viewer can be used in a component with other JavaScript nodes to visualize interactively selected data in the combined view.
View Component | View Workflow
Category: Life Sciences
Author: Janina Mothes
Molecular Sketcher
Can be used to draw molecular structures and is intended to replace the MarvinSketch node, which is no longer openly available. It is based on the Molecule Widget node (requires version 4.3), which uses the Ketcher web-based chemical structure editor.
View Component | View Workflow
Category: Life Sciences
Author: Alice Krebs
January 2021
Variant Effect Predictor
Determines the effect of genetic variants using Ensembl's Variant Effect Predictor (VEP) via their REST API.
View Component | View Workflow
Category: Life Sciences
Author: Jeanette (Jeany) Prinz
Convert Human Genome Assembly
Converts the coordinates between different assembly versions of the human genome. This is done using an endpoint from Ensembl's REST API.
View Component | View Workflow
Category: Life Sciences
Author: Jeanette (Jeany) Prinz
One-Hot Encoder for Biological Sequences
Converts biological sequences (DNA/RNA/Protein) into their one-hot encoded representation. It allows selecting a fitting alphabet and provides different ways of handling unknown characters/letters that are not in the selected alphabet.
View Component | View Workflow
Category: Life Sciences
Author: Temesgen H. Dadi
ARR Analysis
This component provides different ways for finance and business intelligence teams to calculate, visualize, and analyze Annually Recurring Revenue (ARR) - by month and by year, in total, and at a customer level. ARR is a common metric for subscription-based services/products to reflect and predict revenue annually.
View Component | View Workflow
Category: Financial Analysis
Author: Lada Rudnitckaia and Felix Kergl-Räpple

Data Lineage View
Interactively visualizes metadata on a workflow for auditing and governance purposes. The input metadata is provided by the Analyze Workflow Summary component. Via network analysis, the component highlights interesting workflow properties such as: the flow of data from data sources, the presence of code snippets or deprecated nodes, the list of components and their update status, and more.
View Component | View Workflow
Category: Automation
Author: Temesgen H. Dadi
December 2020
Interactive Column Filter
Creates an interactive view to filter and select columns for your model based on the relevance of the columns to the ground truth specified. It also captures the user specified columns by means of integrated deployment.
View Component | View Workflow
Category: Guided Analytics
Author: Mahantesh Pattadkal
Automated Visualization
Automatically visualizes data in a dashboard based on the most interesting statistical properties of the input columns. A detailed explanation is available for each chart inside the dashboard. No configuration is necessary to automatically create the dashboard via the Component Composite View.
View Component | View Workflow
Category: Visualizations
Author: Mahantesh Pattadkal

FASTA Reader
Reads DNA/RNA/Protein sequence files from a FASTA format file. The result is a three column table (ID, Sequence & SequenceLength), where individual sequence records are represented as rows.
View Component | View Workflow
Category: Life Sciences
Author: Temesgen H. Dadi
Generic File Upload
Can be used as a generic file upload for the KNIME WebPortal or locally in KNIME Analytics Platform. It automatically detects the file format and chooses the correct node to read in the data.
View Component | View Workflow
Category: Guided Analytics
Author: Janina Mothes
October 2020

XAI View
This component for eXplainable AI (XAI) can explain predictions of a black-box model created with the AutoML component via SHAP, partial dependence and a surrogate decision tree from KNIME MLI Extension. The generated composite view is interactive and can be customized by adding JavaScript or Plotly View nodes.
View Component | View Workflow
Category: Model Interpretability
Author: Paolo Tamagnini and Mahantesh Pattadkal

Get Versions of Nodes in Workflow
Can be added to a workflow to get a unique list of nodes used in the workflow and the version number of a KNIME feature containing those nodes. The results can be included in reports and data exports for documentation purposes.
View Component | View Workflow
Category: Automation
Author: Temesgen H. Dadi
U-Net 2D - Encoding/Decoding Layers
These two components can be used to create a U-Net for 2D data with the Keras Deep Learning Integration. This kind of deep learning architecture was originally created for biomedical image segmentation but is now frequently used for general image segmentation.
View Encode Component | View Decode Component | View Workflow
Category: Automation
Author: Janina Mothes
August 2020
AutoML
Automatically trains supervised machine learning models for both binary and multiclass classification. It's able to automate the whole ML cycle by performing some data preparation, parameter optimization with cross validation, scoring, evaluation and selection. It also captures the entire end to end process and outputs the deployment workflow using the KNIME Integrated Deployment Extension.
View Component | View Workflow
Category: Automation
Author: Paolo Tamagnini and Mahantesh Pattadkal
Analyze Workflow Summary
Extracts information from a workflow summary XML file that can be obtained from either the File > Export > Workflow Summary (JSON/XML)… menu in KNIME Analytics Platform, or from a KNIME Server's REST API. You can use this Component to easily retrieve metadata of a KNIME Workflow for data lineage and governance purposes.
View Component | View Workflow
Category: Automation
Author: Temesgen H. Dadi
SHAP Summarizer
Can be used before the bottom input port of SHAP Loop Start. This technique uses k-means to summarize the validation set and create a sampling table to use when creating coalitions. The created sampling table is large n rows, each row is a different prototype of the data. This n can be adjusted from the configuration dialogue of the Component. The n default value is 100. The output sampling table has, for each of the n clusters created by k-means, a prototype row and a column "SHAP Summarizer Sampling weight" that can be used by the SHAP Loop Start node.
View Component | View Workflow
Category: Model Interpretability
Author: Mahantesh Pattadkal
Molecular Properties Filter
Allows you to select a subset of molecules based on the input data and molecular properties calculated using the RDKit Descriptor Calculation node. The Interactive View depicts the molecular properties in a parallel coordinates plot, and the molecules' structural formula as tiles. The selected molecules are provided in the Component output. Note that columns from the input table is by default propagated to the parallel coordinates plot.
View Component | View Workflow
Category: Life Sciences
Author: Alice Krebs