Workflow Snippets
Simple workflows that demonstrate how to solve specific tasks.
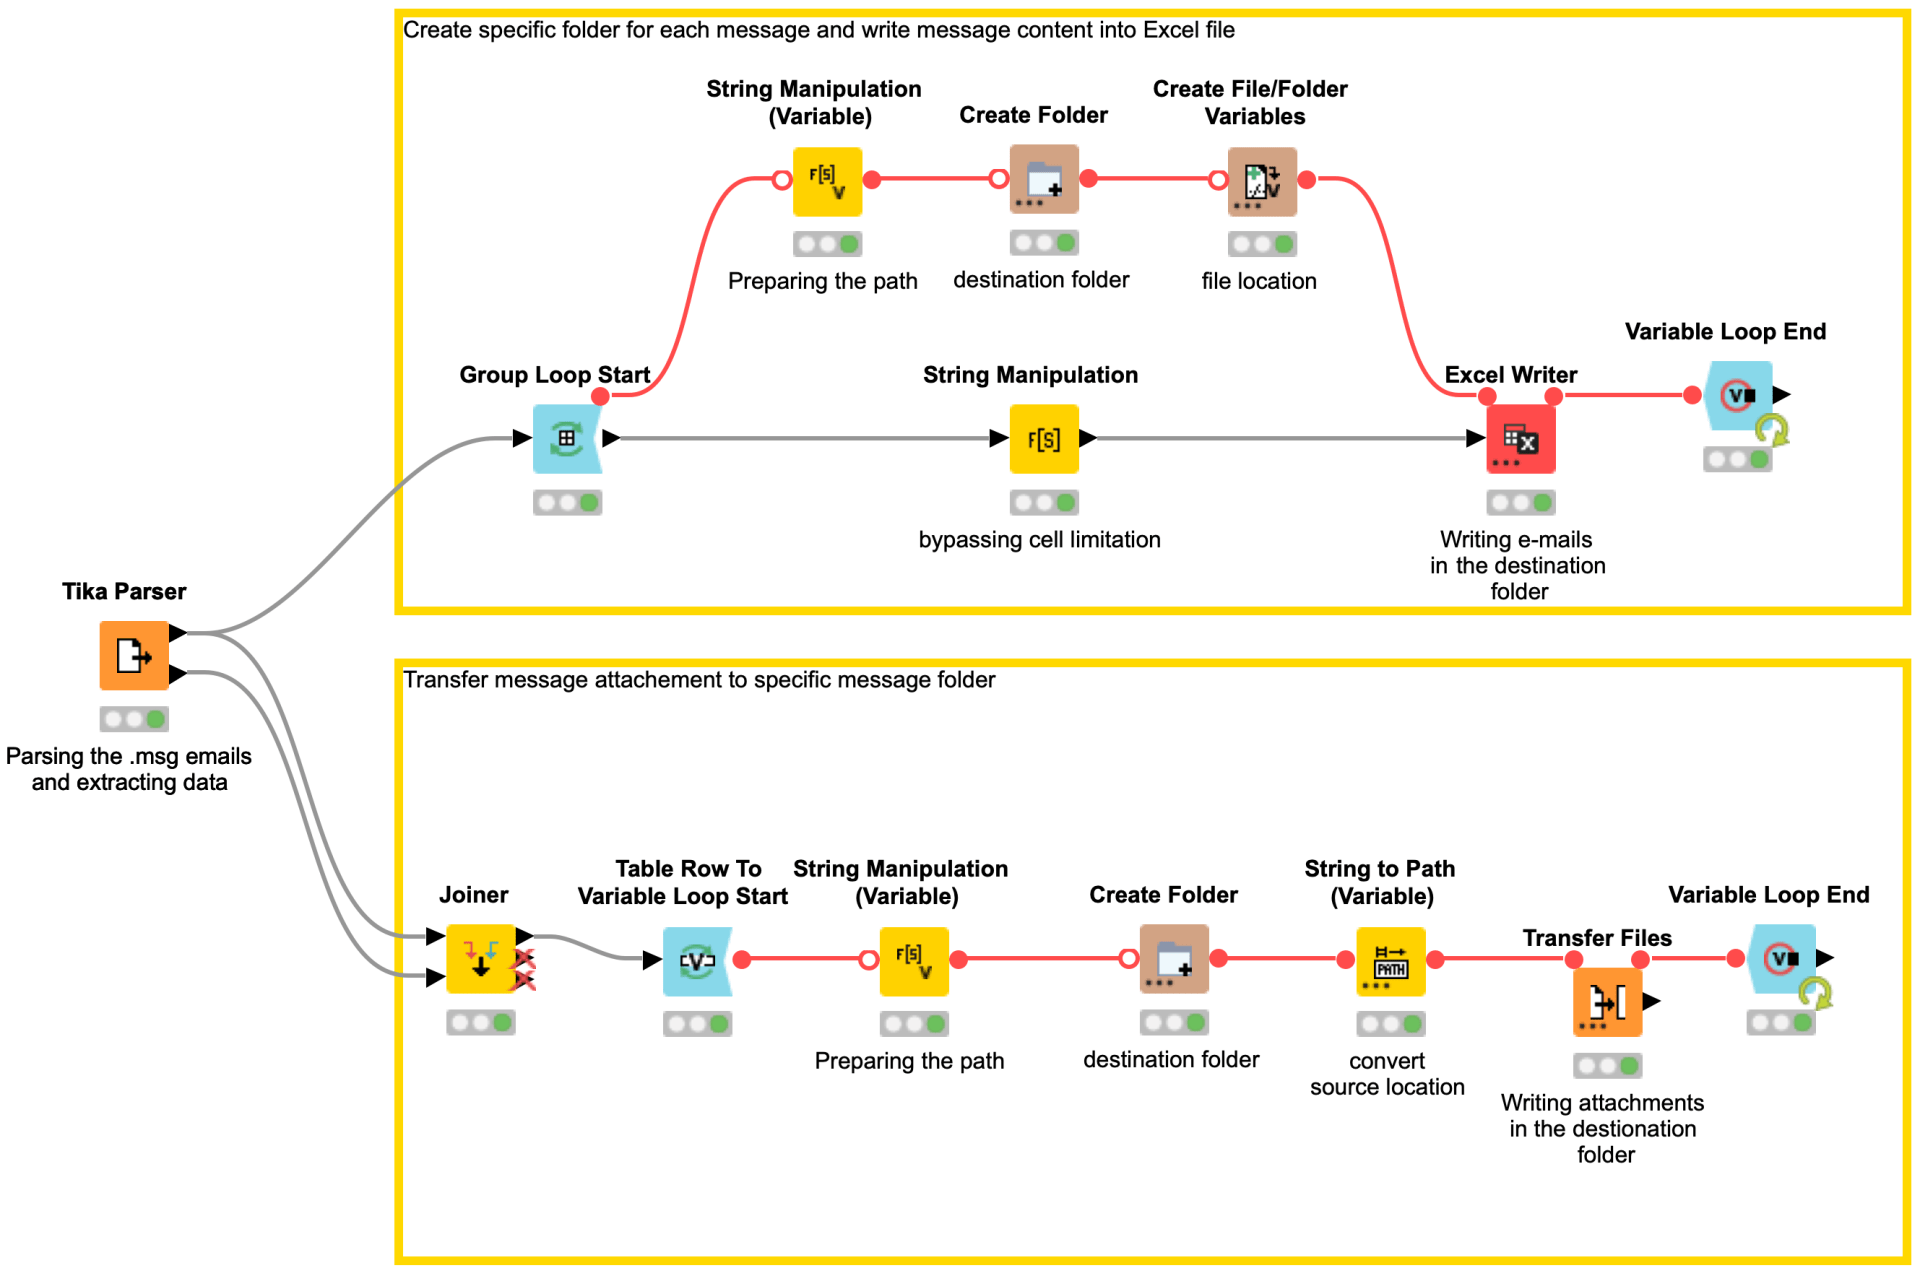
Email & Attachment Organiser
Previous Workflow Snippets
If you want to try webhooks, you can start with this workflow snippet. Webhooks are automated messages sent from apps when something happens. For example, GitHub Webhooks can notify you if there is a git push event and trigger any workflow for further action. This could be a useful feature for versioning and synchronizing KNIME Server and GitHub repositories. But there are far more use cases for webhooks.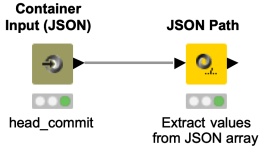
⇒ Download Extract Webhook Payload Properties from KNIME Hub
The Math Formula node allows you to perform row-wise calculations like calculating the difference between the values in column A and B and some column-wise calculations, like calculating the column mean. But what about calculations between values in the same column? This workflow snippet shows you two ways of subtracting the values of two consecutive rows in one column.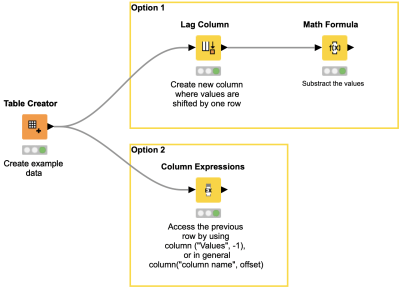
⇒ Download Calculate the Difference between Two Consecutive Rows from KNIME Hub
Whenever we start working with selection widget nodes, there comes the time where we do not want to enter all our possible choices by hand all the time. This workflow snippet shows how this can be achieved in a more automatic fashion. You can simply create a set (collection) from all possible values inside a single column. This can then be used for our possible choices in a single selection widget node which triggers a plot view.
Have you ever wondered how many nodes your workflows contain, how deeply nested the nodes are and what type the nodes have? This workflow snippet analyzes your workflow and provides exactly that information. The result can be used to visualize the distribution of nodes and serve as a starting point to improve your workflows (e.g. by finding redundant nodes).
Do you find formatting multiple excel sheets time-consuming and repetitive? Wouldn’t it be great to format multiple sheets in an Excel File in a single workflow? This workflow snippet provides you with an example of how you can set up a loop that iterates over each sheet in a file and use a Control Table node that generates a control table, the table simply serves as a template table containing certain tags for the cells, which are going to be formatted. 
Wouldn’t it be great to have an overview of all occurrences of a given search term in a table? This workflow snippet does exactly that for you. You can provide a search term and the workflow will return a list of all occurrences with their corresponding row identifiers and column names. The result can be used to manipulate the individual values with an additional workflow.
⇒ Download Search Table for Occurrences Based on Term from KNIME Hub
In case you want to build your own visualizations, but don't want to start from scratch, you can always use Javascript code within KNIME. The existing KNIME widget nodes can take user input, which can then be used within your charts. The following is an example of a custom bar chart combined with KNIME nodes.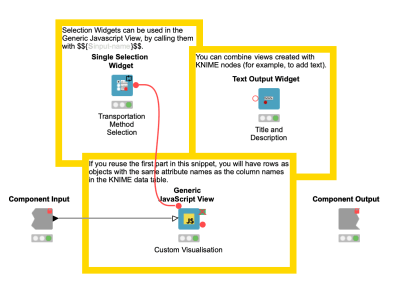
If you create an interactive view in a component, it often feels natural to download the analyzed and selected data at the end of the page. This is where the File Download Widget node comes into play. In this workflow snippet, you will see a simple way to create a component that includes a link that allows you to download an Excel file.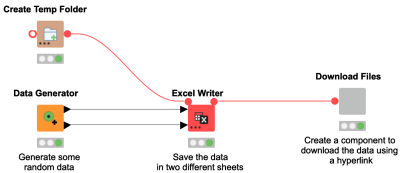
Have you ever wanted to integrate your Python-based exploratory data analysis and model building into your workflow but didn’t know how? This is where KNIME’s repository of Python nodes is of excellent use. This workflow snippet illustrates how to create a pairplot visualization in KNIME using the Seaborn library and build a Random Forest model using the Scikit-learn library.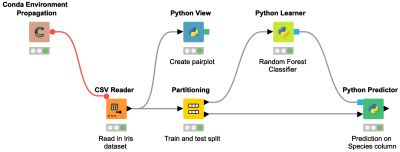
⇒ Download EDA and Model Building Using Python from KNIME Hub
Have you ever needed to generate a very specific visualization, and couldn’t find a KNIME node to produce exactly what you need? In many cases you can write just a few lines of code and use an R View node to tackle the problem. This workflow shows how you can generate a “pairs” plot, a widely used diagnostic tool in statistical analyses, that includes an overlaid regression line on top of a scatter plot for each combination of variables you’re interested in.
Sometimes when returning API responses, the value returned could be a Binary value or a BLOB variable type. This workflow snippet is to quickly assist in transforming this variable type from a binary to JSON and then finally to a consumable table, which can then be used throughout the rest of the workflow.
⇒ Download Analyzing BLOB data from iTunes web data retrieval from KNIME Hub
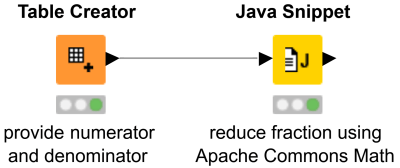
Sometimes there is just not the right node to solve your specific problem. This is where Snippet nodes can help. Java Snippets are very convenient to use: they do not need any additional configuration to run, since they are using the Java Runtime Environment that KNIME Analytics Platform is bundled with. And if you need some libraries that are not already part of the JRE, you can simply add them via the node configuration, like here in this workflow snippet where we use the Apache Commons Math library to reduce a fraction.
⇒ Download Java Snippet Using External Library from KNIME Hub
Ever had a file that’s a JSON, but the JSON Reader node won’t do it? Possibly that’s because it is a multi-line JSON. This workflow snippet uses a short and easy example JSON and shows how to read and parse these files in KNIME with just three nodes. Maybe this will do the trick for your data too.
Ever got annoyed that you cannot join two datasets on strings because they aren't an exact match? Fuzzy matching to the rescue! This workflow snippet demonstrates how the String Matcher node can be used to realize such a fuzzy matching without you knowing anything about the Levenshtein distance (it is still worth looking it up).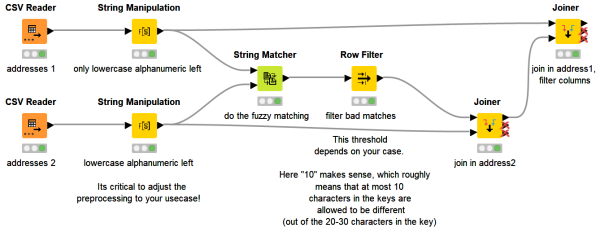
If a workflow is executed on a regular basis you might want to add the execution date to the file name to avoid overwriting the file from the previous day. This workflow snippet shows how you can do so by adding the execution date to the file name automatically, before creating a path flow variable with the new file name.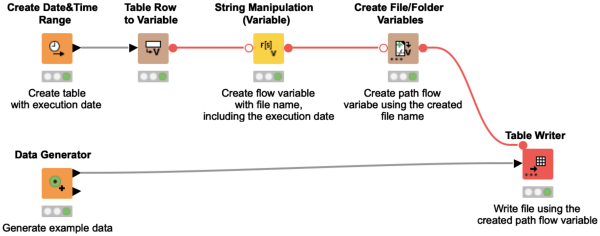
⇒ Download Integrate Execution Date in File Name from KNIME Hub
KNIME and Python do not need to exclude each other but can rather go hand in hand. This workflow snippet demonstrates how easy it is to load a machine learning model trained in Python into KNIME using Pickle. The Python Predictor node can then be used to apply the model on new data in KNIME.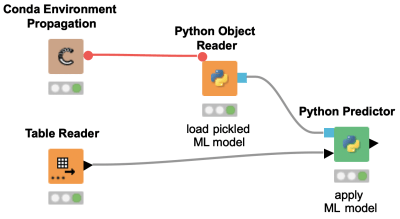
Did you ever wonder how you can pass an image to a KNIME workflow via the REST interface? This workflow snippet shows how a base64 string coming in via Container Input (JSON) node can be converted into a KNIME PNG cell in a data table. It demonstrates the usage of the Java Snippet node to generate binary object cells and augments it with a Binary Objects to PNGs node for the final output.
The External Tools Node lets you call executable files for other applications. It's especially useful for working with Shell scripts and Window’s executables so that you can integrate KNIME with your existing processes and applications.
Always wanted to generate beautiful reports with the Business Intelligence and Reporting Tool (BIRT) and never dared to try? This workflow snippet gives you an excellent opportunity to learn how to transfer several different data elements to a BIRT report using KNIME Report Designer.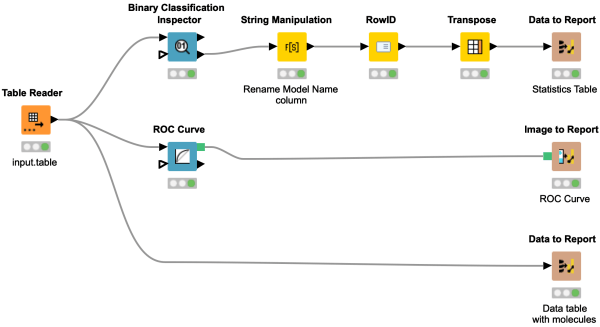
Connecting to a Database could fail for multiple reasons such as network related issues, too many connections to the server at a time, etc. It is desirable to automatically retry connecting to a database a couple of times to avoid a failure of workflow execution due to a temporary glitch. This workflow snippet shows one way of doing that.

Ever got impressed by the many different ways in which chemists can represent the same thing? In this workflow snippet we show how to use the open-source RDKit nodes to standardize molecular structures. In particular we have a look at the Remove Hs, Salt Stripper and Structure Normalizer nodes.
⇒ Download Standardizing Molecular Structures from KNIME Hub
This workflow snippet demonstrates an example query to a GraphQL API. The Open Targets Platform provides a GraphQL API, which supports queries for a single target, disease/phenotype, drug, or target-disease association. Here, we are using Ensembl Gene IDs to query more information, e.g. description, genomic location, associated disease, ...
This workflow snippet demonstrates how to use an already trained model on new data to predict bioactivity. Simply load the trained model with the Model Reader node and provide this to the corresponding Predictor Node, in our case this is the Random Forest Predictor node.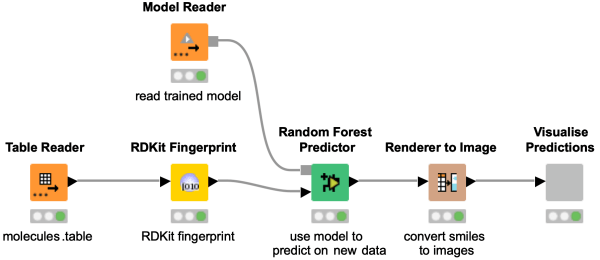
Did you even wonder how you can train a bioactivity model using chemical structures? Take a look at this workflow snippet, to learn how to transform chemical structures into hashed bit-based fingerprints, which serve as an input for a Random Forest model to predict CDPK1 bioactivity. Evaluate the model performance using the ROC Curve and the confusion matrix.
This workflow snippet shows how a time-to-event analysis can be easily done using KNIME Analytics Platform. You simply upload a file containing the corresponding data from a clinical study, e.g. in .xpt format, and after a small column manipulation the event is ready to be analyzed in the Kaplan-Meier Plot.
⇒ Download Time-to-Event Analysis using the Kaplan-Meier Plot from KNIME Hub
This workflow snippet counts the number of atoms in a molecule for an element of choice. This is done by first getting the molecular formula and using regex to extract the number of atoms.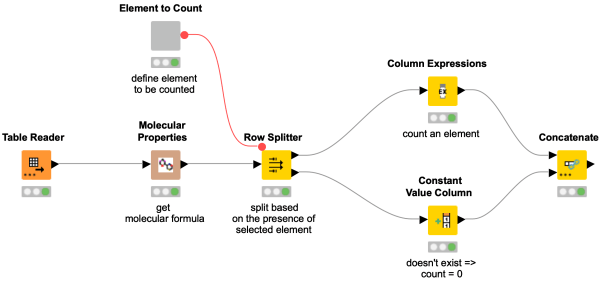
Sometimes special colors are needed to let your report shine! This workflow shows you how to customize colors in your chart using KNIME Analytics Platform.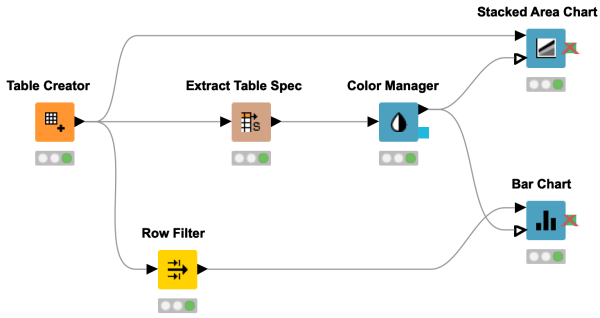
This workflow shows you how to create a clickable hyperlink in the Table View. It takes PubMed IDs as input and manipulates them into a certain format. This makes your interactive views even more interactive and allows you to open other pages right away from the Table View.
This workflow snippet is meant as a sequel to the previous one, where we showed you how to align molecules. There are some cases where the alignment might not have worked for you right away, e.g. when your drawn structure contains aromaticity. Learn in this snippet how to sanitize SMARTS for any kind of queries (or well, to finally align your molecules).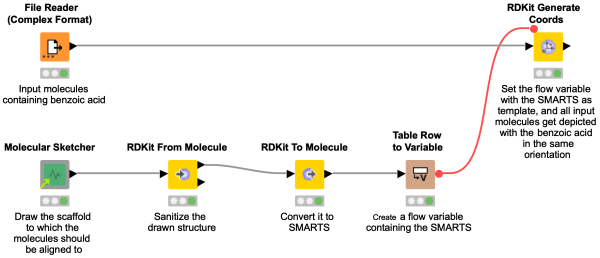
Your molecules all contain the same substructure, but they are not aligned accordingly and deep down it’s driving you somehow nuts? Check out this workflow snippet that shows you how to align the orientation of molecules according to a drawn substructure. Using the SMARTS thereof we can then generate 2D coordinates for all the molecules. If you run into trouble with the SMARTS, check out the next workflow snippet where we will show you how to sanitize them.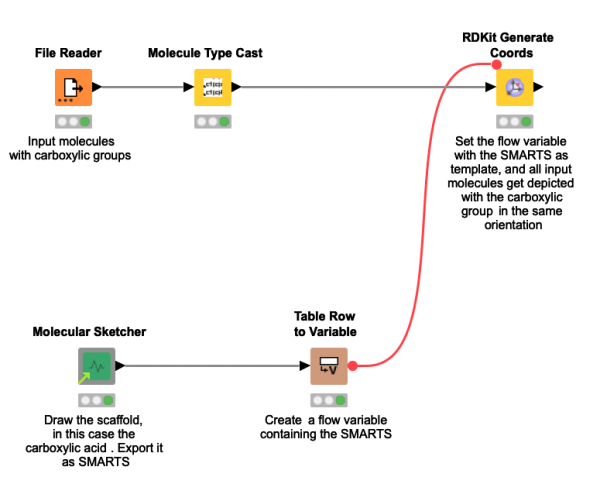
⇒ Download Align the Orientation of Molecules from KNIME Hub
The Table Manipulator node is rarely used, although it combines quite some functionalities. You can use it to rename columns, resort the column order, change the column types and select which columns to include or exclude from your table. Have a look at this workflow snippet to see the Table Manipulator node in action.
⇒ Download Manipulate Several Columns at Once from KNIME Hub
Would you like to color individual cells in your data table based on a certain value? This workflow snippet shows how to customize the individual cells in the table using the HTML color groups.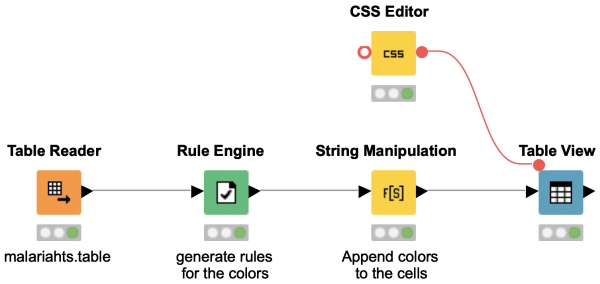
Do you want to use your favorite python library to create highly customized plots from the KNIME Analytics platform? This example workflow shows how to create a 2D kernel density estimate (KDE) plot using the seaborn (https://seaborn.pydata.org/) python data visualization library.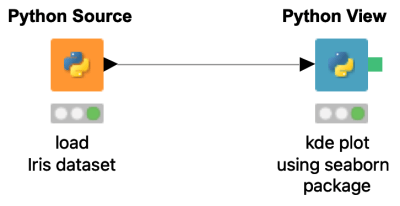
Learn how to apply a flow variable with multiple columns. Using the example of filtering multiple columns, we extract the column names of our data, create a collection column containing the desired column names, and then generate a variable that we use in the column filter node.
⇒ Download Multiple Columns as Flow Variables from KNIME Hub
Discover in this workflow snippet how to do matched molecular pairs analysis in KNIME. Check the preprocessing of the molecules happening in the metanode, and find matches in your data set with the nodes from the Vernalis community extension.
This workflow snippet to format your Excel file might appear very complex in the beginning, but once you get the hang of it, you can easily automate your Excel formatting and reduce your manual work. More time to do fun stuff.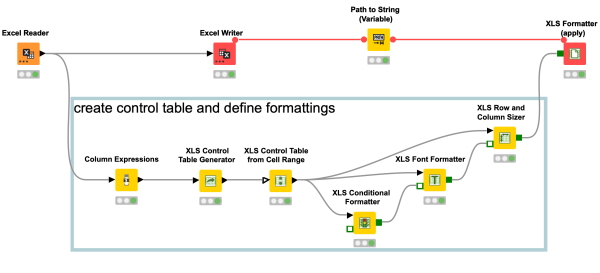
Did you know that the Excel Writer node does not only export strings and numerical values to your Excel file, but also images? This comes in handy when you want to export images of your molecules. Simply use the Renderer to Image node and export your PNGs to Excel.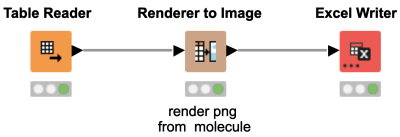
Interested in finding hidden relationships in your data and demonstrating it to your colleagues in a clear and concise way? This workflow snippet shows how to visually explore a dataset with molecules and their properties.
Do you want to fetch data from a database without loading a complete database table? You are interested in just a couple of columns and some rows meeting a certain criteria? This workflow snippet shows how to get only the attributes & records you need as a KNIME table.
Do you want to combine the power of KNIME with your favourite R library? Learn in this easy workflow snippet how to import a R package and create a simple R plot.
Wondering what a whole row of 0s and 1s have to do with chemical structures? Want to investigate the similarity of molecules? Have a look at this workflow snippet demonstrating how to compute molecular fingerprints in KNIME and giving some background information.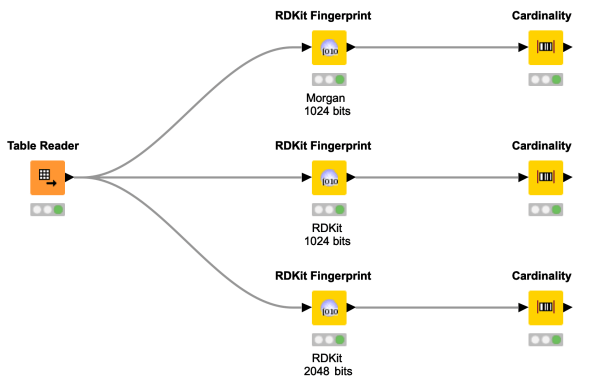
Good things come to those who wait! Of course, with “good things” we mean finally being able to explore molecules in 3D with KNIME. Have a look at this workflow snippet demonstrating how to query the Protein Data Bank (PDB) and visualising the results in 3D using the 3D Molecule Viewer component. This was definitely worth the wait!
Don't have a ChemAxon license and miss the MarvinSketch node? Try this component to draw molecules, chemical structures and reactions. Depending on your choice, the output is available in two different chemical data formats. And as a cherry on top, you can even supply input SMILES by flow variable!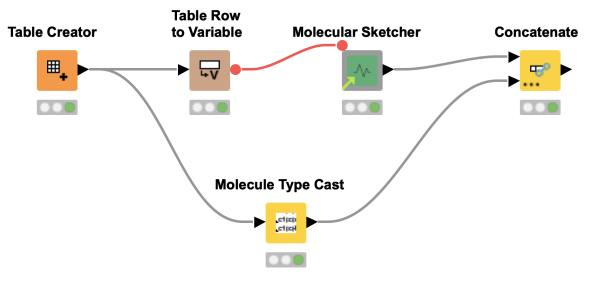
Have you ever heard of Streaming in KNIME? No, we did not integrate Netflix. Streaming in KNIME enables you to execute certain nodes in a section of your workflow concurrently, instead of node by node. This way, the results of one node are instantly provided as input to downstream nodes, which cuts down memory usage and speeds up your calculations.
Did you ever wonder how to retrieve data from a (public) web service like mygene.info or maybe ChEMBL? Just use the GET Request node of KNIME and enter the URL as demonstrated in this workflow snippet. The JSON Path node or XML Path node will help you to parse the retrieved data. And off you go with the latest data for your use case!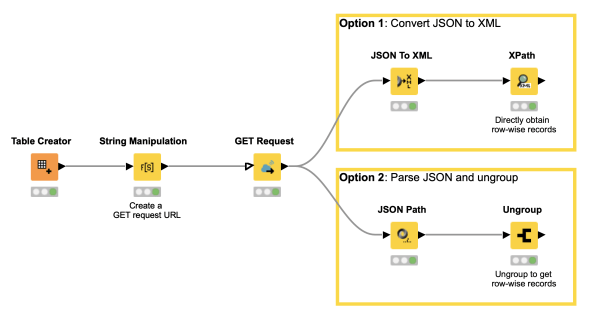
If you want to combine several plots to one interactive view, have a look at this workflow snippet! It shows an interactive view "Explore Data" generated from several JavaScript nodes (Parallel Coordinates Plot, Table Editor, Pie/Donut Chart, Tile View and Scatter Plot). By combining several JavaScript nodes that operate on the same data table in one component, the interactivity of the combined view is automatically achieved.
The Molecule Type Cast node can be sometimes overlooked, but it is important if you want to convert a string column into any molecule type, such as Mol2, PDB, SDF, CML, HELM, SLN, SMILES, SMARTS or RXN. This workflow snippet demonstrates the use of the Molecule Type Cast node to convert a string to the SMILES data format. In a second step, a RDKit node is used to canonicalize the SMILES.

