In a recent blog post, we discussed creating web services using KNIME Analytics Platform and KNIME Server - now we want to look at calling web services with KNIME.
Since this post is from the Life Sciences team at KNIME and we’ve been investigating ChEMBL web services recently, we’d like to use them as an example here. Please note that there is a set of community KNIME nodes for accessing ChEMBL and ChEBI and we are intentionally duplicating some of that functionality here.
ChEMBL itself is a great Open Data resource. It provides a large collection of linked information on compounds and their structures, biological targets and their sequences, biological assays and their experimental details. The data are largely collected from scientific publications with each entry in the database represented by a unique identifier - a ChEMBL ID. It’s all freely available for download in relational form or can be accessed using a REST API. That’s what we look at here.
Don’t stop reading... if you’re from another field and not really interested in ChEMBL or the data it contains! The patterns we use here for interacting with the web services and looking at the results will work for many other RESTful web APIs.
Calling one single REST Service
When we first sat down to try out the ChEMBL services, we started with a very simple, four-node workflow:

This table shows the URLs we’re fetching. They retrieve data about the compounds with the unique identifiers CHEMBL ID as CHEMBL25 (aspirin) and CHEMBL1201320 (esomeprazole), respectively.

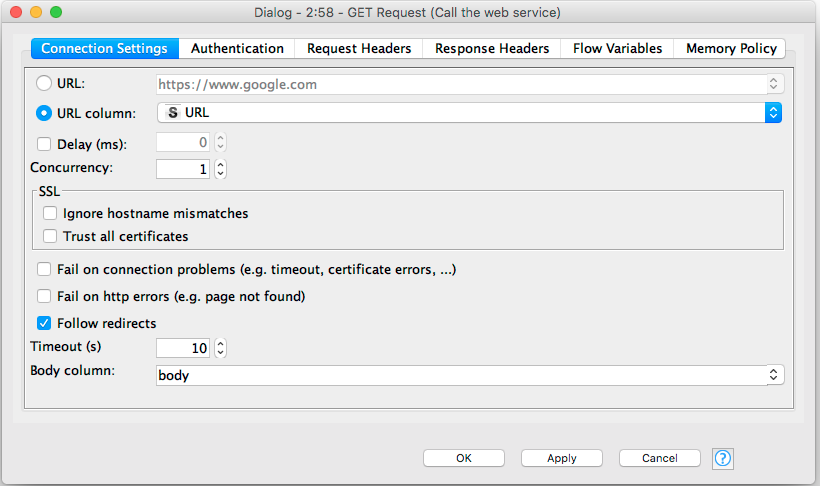
Configuring the GET Request node is almost embarrassingly easy:
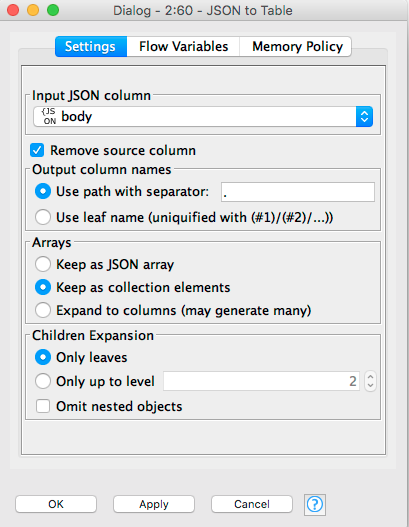
We’ve asked the web service to return JSON, so the next node is a JSON to Table node. We configure this to extract all of the elements in the nested JSON objects returned by the ChEMBL service:
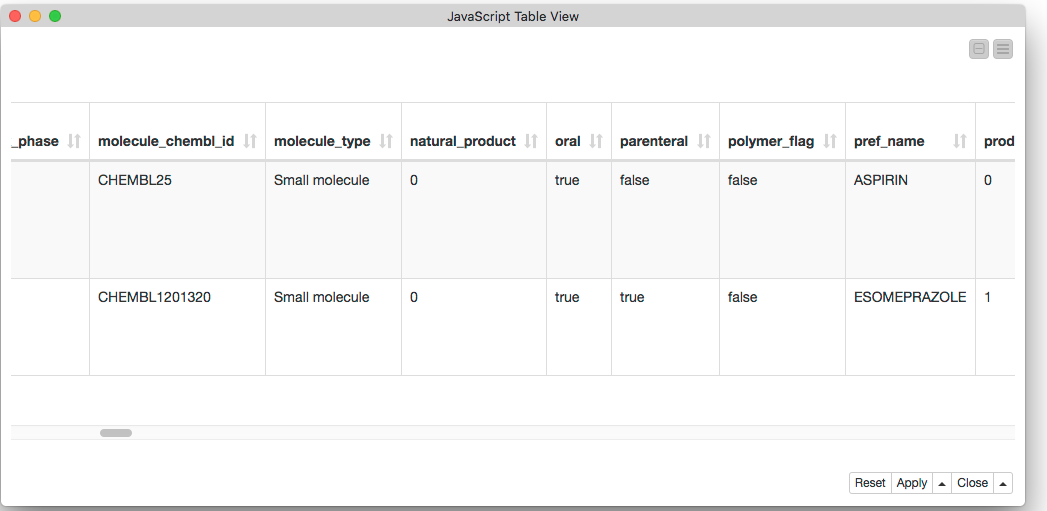
Finally we can look at the results. Here’s part of the table showing the two compounds we wanted: aspirin and esomeprazole.
Orchestrating a Cascade of REST Services
This simple workflow enables us to fetch the information contained in ChEMBL about a couple of molecules. This was easy to put together and is quite useful, but there are things we can do to make it even better. Have a look at this:
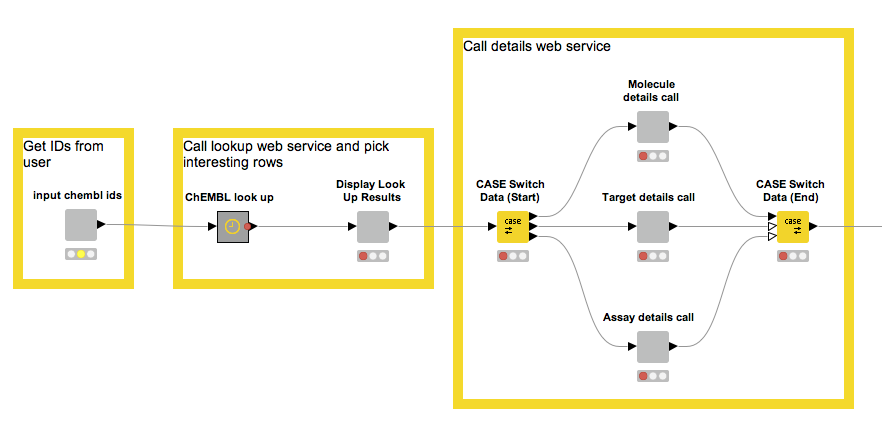
We start by making it possible to provide a list of ChEMBL IDs.
- We use the ChEMBL look-up service to figure out if they exist and, if so, what type of entity they correspond to.
- The third node is interactive and through a UI allows us to pick the type of entity we want more information about.
- Based on the previous type choice, the set of nodes inside the CASE Switch performs the appropriate web service calls, while output parsing moves the results into a KNIME table for further processing.
- The metanodes and wrapped metanodes encapsulate a lot of complexity and, in the case of the wrapped metanodes, allow us to combine a number of interactive views into one composite view (more information about this can be found in the KNIME TV video “Data Viz with KNIME”).
Not only can we take advantage of this interactivity in KNIME Analytics Platform, we can also use it in the WebPortal by deploying the workflow to the KNIME Server. This functionality allows our workflow to be used as a web application by people who may not want to use KNIME Analytics Platform (such people actually do exist!) or who may not currently have the Analytics Platform installed.
Although we show what it looks like to use this workflow via the WebPortal below, you can also check out the views we show in KNIME Analytics Platform itself. Right-click the wrapped metanodes and select Interactive View.
Step 1. Retrieving the list of Molecules via ChEMBL IDs.
We start with a prompt for the set of ChEMBL IDs we want to look up:

These IDs are then passed to the ChEMBL look-up service, which returns the type of each entity it finds along with the URL that can be used to look up details about it. We display these results using a pair of linked tables. The first allows us to select an entity type and the second shows the entities of the types that were found:
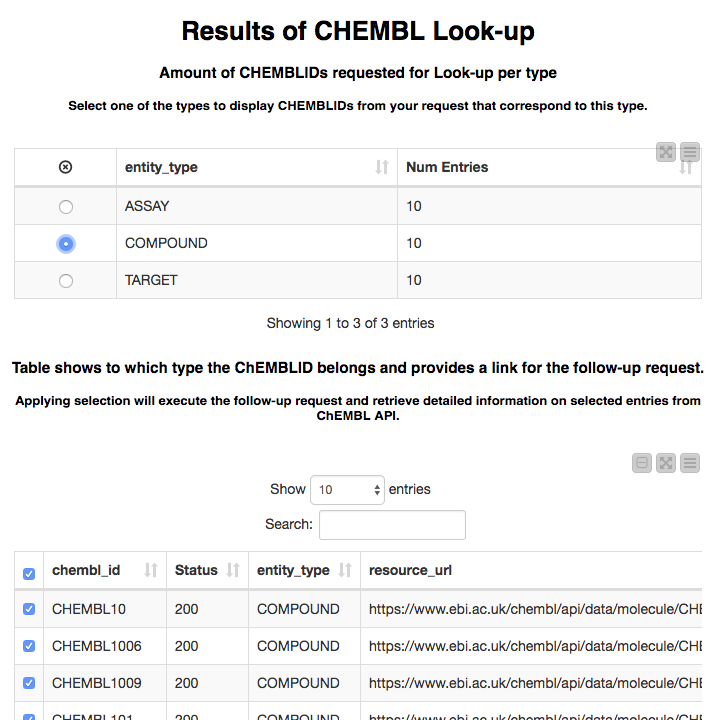
Step 2. Retrieving the Details for the Selected Molecules
After selecting the entity type we want to work with and de-selecting any rows we are not interested in, we click the “Next” button (not shown in the screenshot). The output of calling the ChEMBL details web services with those rows is displayed in the next page, shown here for a few compounds:
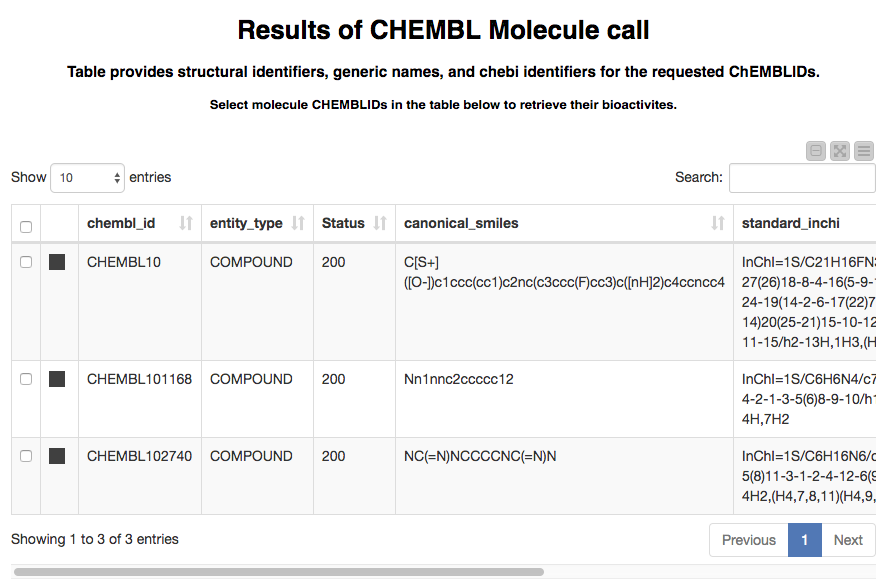
Now we’ve got the structural information that ChEMBL stores for the compounds we looked up. This is nice by itself if we’re just interested in chemistry, but we often also want to see the bioactivity data that can be found in ChEMBL. The next part of the workflow takes care of this.
We pick several compounds for which we would like to retrieve the bioactivities (let it be CHEMBL10 and CHEMBL102740) and click the "Next" button. After a few seconds the following page with two linked tables comes up. Only a few rows and columns of the second table are displayed here.
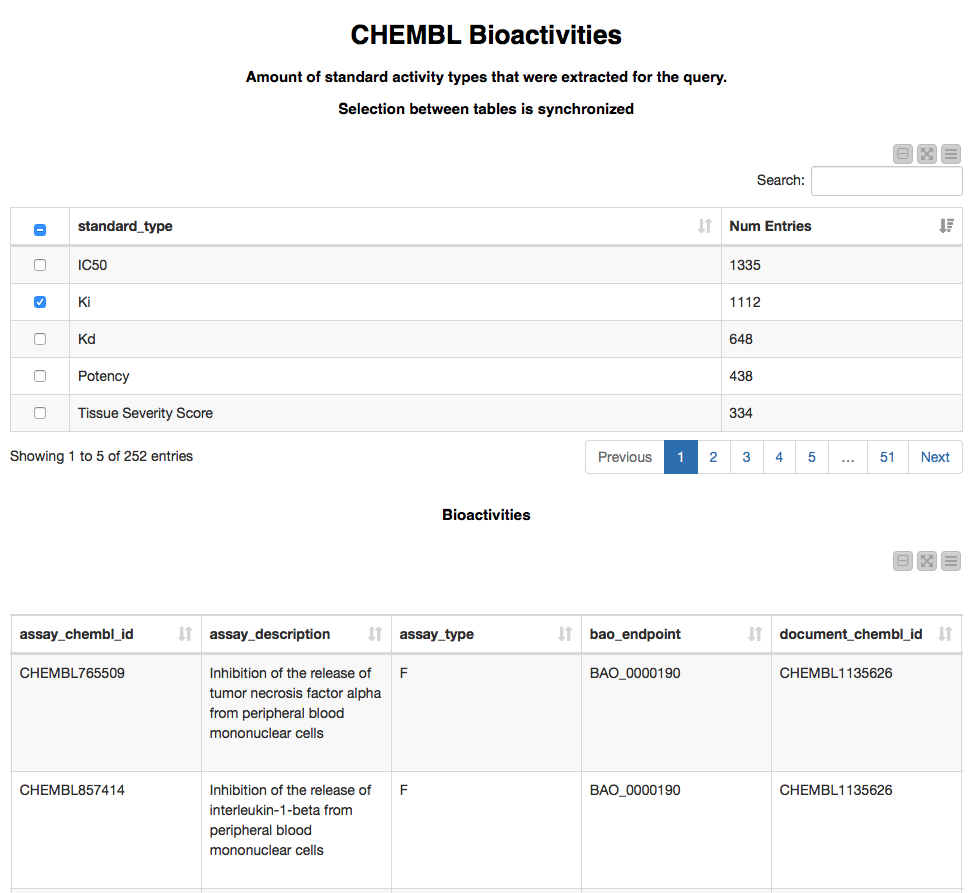
This page allows us to explore which types of bioactivities were found using the first table. Selecting one of the bioactivity types in the first table will show the matching entries in the second table. The second table provides extensive information on each bioactivity point such as assay, compound, target, and publication details. This Bioactivity call could be performed for Assays and Targets as well. For this example we are extracting up to 1000 bioactivity data points per entry; to retrieve all of the available data points we could incorporate the Bioactivity GET Request node (it's hiding inside the ChEMBL Bioactivity Metanode) in a loop using one of our example workflows (Looping over chunks of the data).
Step 3. Similarity Search across Molecules
Some of you might be quite familiar with the full functionality of ChEMBL nodes, which allow similarity and substructure searches for compounds based on their SMILES representation. We felt our REST example would be lacking if we didn’t try that out too. So here it comes.
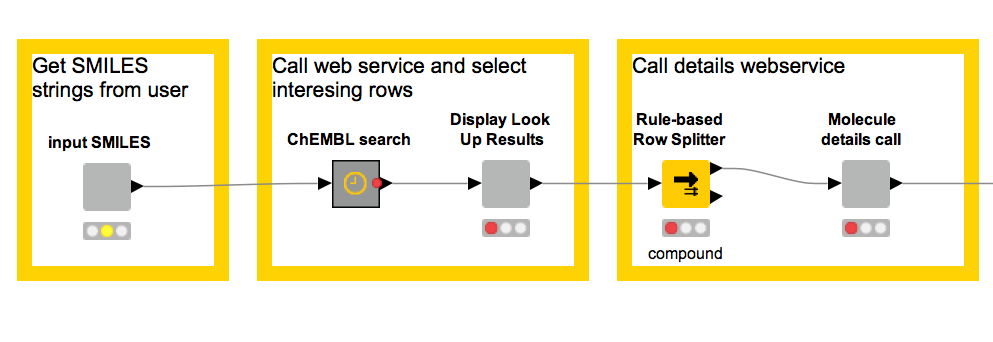
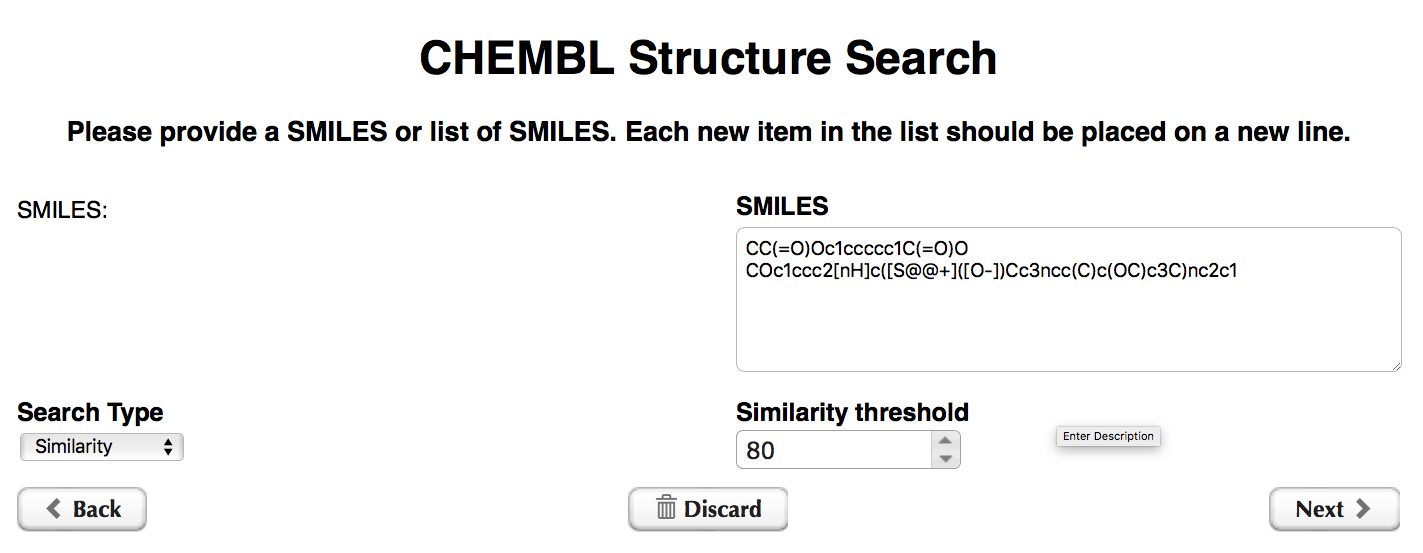
The workflow starts by asking us to provide SMILES strings for the search and to select Search Type (Similarity or Substructure) and Similarity threshold (used only for the Similarity Search Type).
Next, the results of structure search are displayed in two tables: Successful queries (shown below) and Failed queries.
Figure 13: The second page of the ChEMBL Structure Search workflow displays the results of structure search.
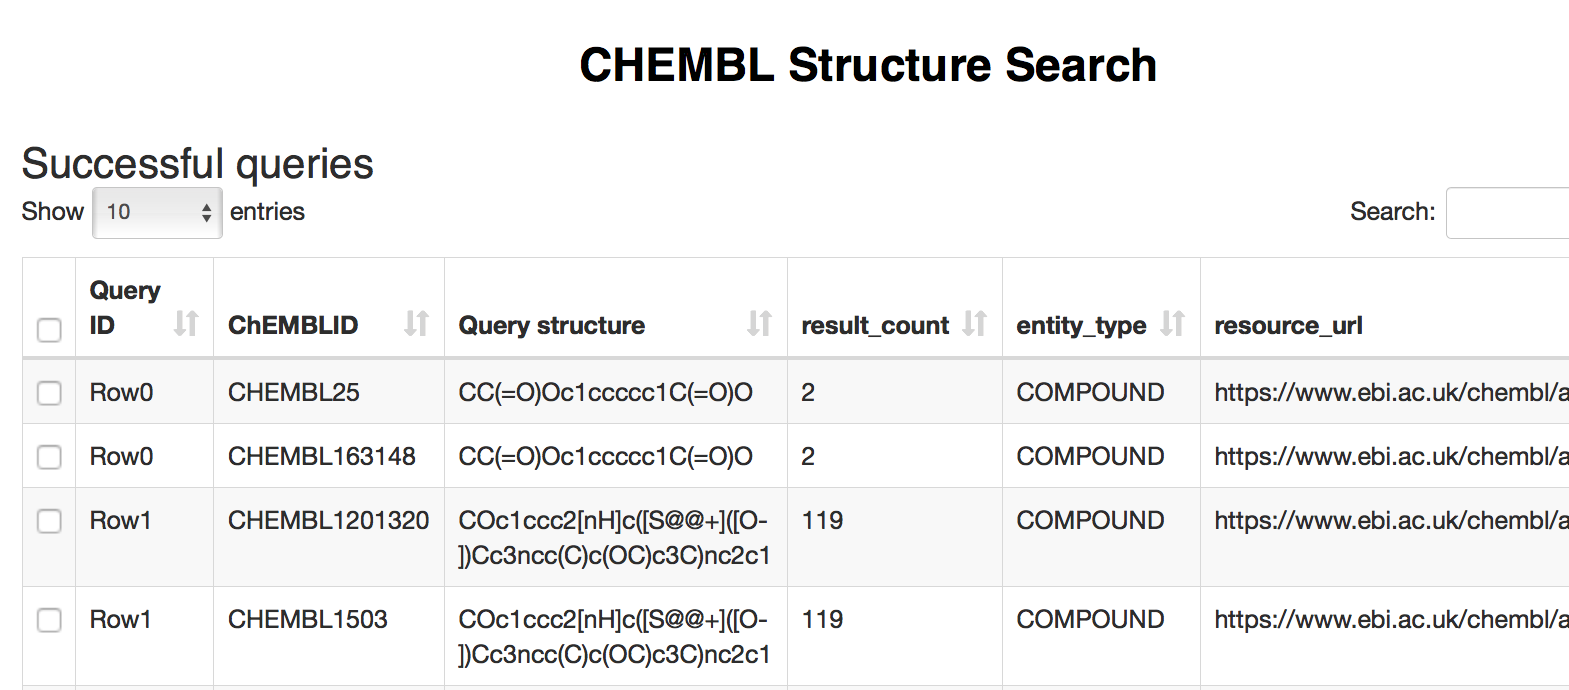
At this point we can pick entries (or select all retrieved compounds) and continue exploring the data available for these compounds in the latest ChEMBL release via Molecule Details and Bioactivity nodes, which are described in the first workflow.
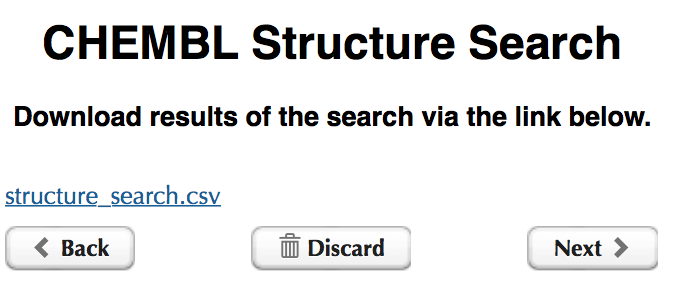
As a final touch in the web service workflows, we added the option to download the results of the searches as comma-separated files. To do this, select the results and proceed to the next page in the Web portal
Wrapping up
In this post we started with a quick workflow for accessing ChEMBL web services from within KNIME Analytics platform. We then expanded that workflow and showed how to add some interactive views to make it useable as a web application with the KNIME WebPortal. This is really just a starting point; we could do a lot more with ChEMBL web services from within KNIME and this could be revisited in a future blog post! In the meantime, however, we hope we’ve managed to spark your interest and find the workflows themselves useful.
Download the sample workflows from the KNIME Hub:
- ChEMBL REST Services workflow
- ChEMBL Structure Search workflow
