
The cheminformatics world is replete with software tools and file formats for the design, manipulation and management of small molecules and libraries thereof. Those tools and formats are often specialized in analyzing small molecules of ~500 daltons, give or take a few, or those molecules that can reasonably be drawn and understood using classic ball-and-stick or molecular coordinate frameworks. Perhaps not coincidentally, this neatly envelops the needs of small molecule drug discovery, where it is not uncommon to find both public and privately-held repositories of hundreds of thousands (to millions) of such molecules, for use in molecular or phenotypic screening assays. The small size and elemental simplicity of these molecules has resulted in a variety of storage file formats (e.g., mol, SMILES, sdf, etc) and many supporting software packages (e.g., RDkit, CDK, ChemAxon, etc) for visualization and manipulation that support them. KNIME Analytics Platform provides easy access to those file formats and software packages.
Challenged by the advent of biologic therapeutics
However, the advent of ‘biologic’ therapeutics, such as antibodies and oligonucleotides, created a new problem: how can much larger molecules be represented and stored, when a molecular drawing of precise coordinates may be either prohibitively large and difficult to assemble, or when the molecular coordinates themselves cannot be known with full precision?
Enter HELM
Within the last few years, an open-source notation known as the Hierarchical Editing Language for Macromolecules, or HELM, has emerged as a useful solution to this dilemma. The simple yet powerful logic of HELM is that small monomers, represented and visualized using the *.mol format, can act as building blocks for larger molecules. Additionally, these monomers are encoded interchangeably by an abbreviated syntax, so that large and complex molecules can be written and stored as relatively short strings.
HELM was initially conceived as a project within Pfizer1. It has been developed further by members of the Pistoia Alliance, whose stated goal is pre-competitive collaboration leading to innovation for R&D2. Recently and for the first time, a curated library of HELM monomers was made available on the website monomer.org3. This library can be a useful starting point for users looking to develop their own internal monomer sets.
This blog post will demonstrate how the KNIME Analytics Platform can be used to:
- Access and visualize monomers from the online HELM monomer library
- Provide basic statistics on library composition
- Perform Guided Analytics for substructure searching within the library
In each scenario, we introduce the concept of components for packaging the final visual layouts - as a precursor for developing interactive Webportal views.
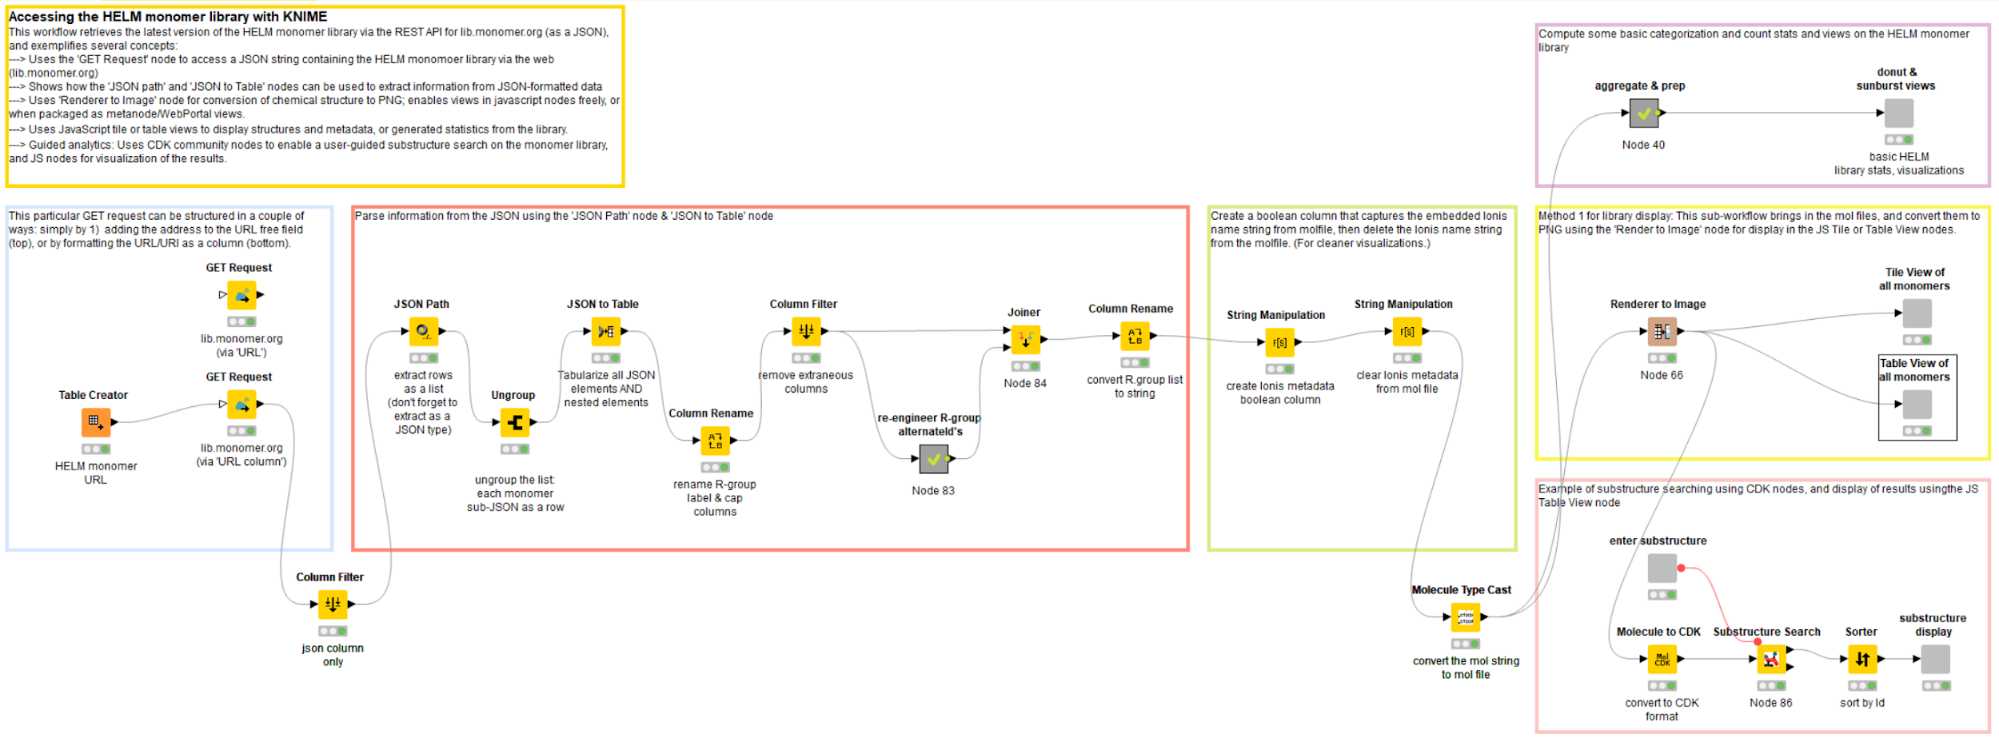
Accessing the HELM monomer library through a REST API
Key points:
Key points:
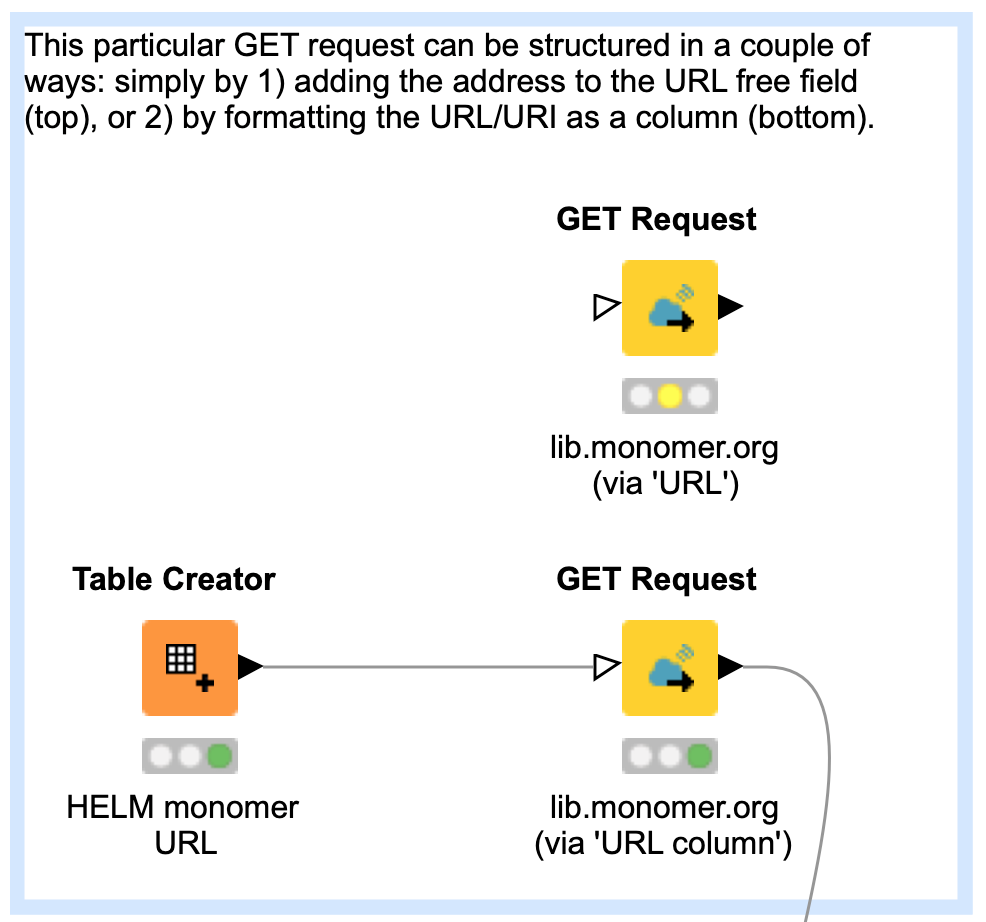
- Use ‘GET’ node to access monomer library REST API
- Alternative inputs to ‘GET’ node: column URI or manual URL entry
- Returns: JSON-formatted column
The first step in the workflow is to retrieve the HELM monomer library, which is stored as a JSON string, from the website monomer.org4. This is achieved by directing the ‘GET’ node to the library URL; the retrieved content type is automatically converted to the JSON column format.
Two alternatives for performing this action are provided:
- Manual entry of the URL into the node UI field, which is sufficient for single entry jobs, or
- Included as an URI-formatted column from an incoming table, if the goal is to cycle through multiple URLs
Extracting and cleaning data from the JSON-formatted library
Key points:
Key points:
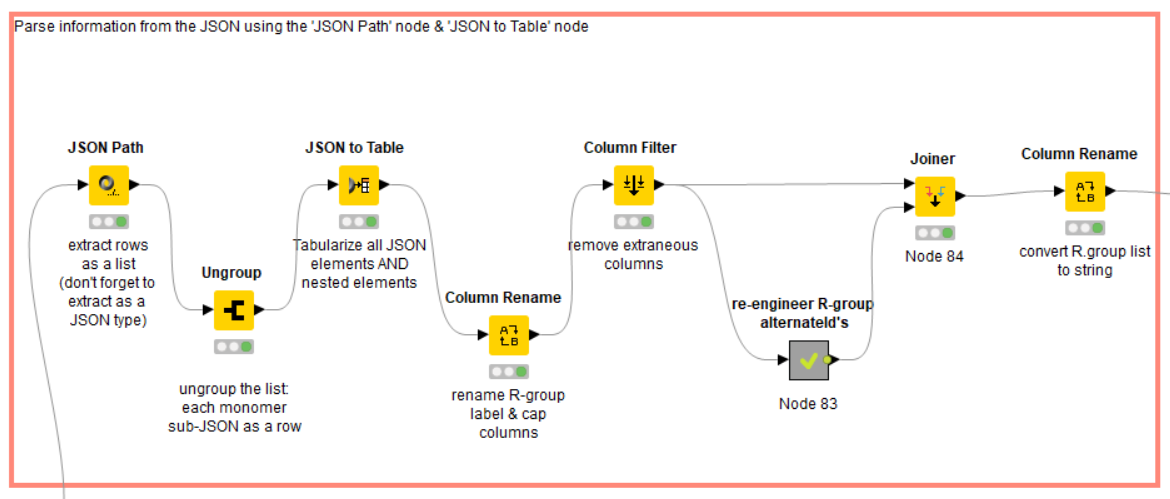
- Working with JSON-type data: Using the ‘JSON Path’, ‘Ungroup’ and ‘JSON to Table’ nodes.
- Library data understanding & clean-up needed at this step: spotted several incomplete R3 fields; these needed to be re-constructed for completeness.
- Message on art of approach: There can be several paths to the same goal
This HELM library contains 580 monomers, each with up to three R-groups that describe the conjugate chemistry necessary for macromolecule assembly. The single JSON is ‘broken’ into the 580 rows, each containing a single monomer JSON string by using sequentially the ‘JSON Path’ and ‘Ungroup’ nodes. Subsequently, the ‘JSON to Table’ node extracts all fields from each JSON row, and composites them into a single table of dimensions 580 x 23; redundant fields are given unique column names automatically.
The goal of this section of the workflow is to organize key metadata for each monomer (molecule name, mol structure file, R-group definitions, etc.), and remove ancillary or redundant information. KNIME facilitates data understanding by providing output views for each node, so that the data can be checked (and corrected) for completeness, errors, etc.
Generating library statistics and visual representations
Key points:
Key points:
- Use ‘GroupBy’ node to aggregate and count molecule or polymer types.
- Use ‘Pie/Donut Chart’ and ‘Sunburst Chart’ nodes to visualize counts.
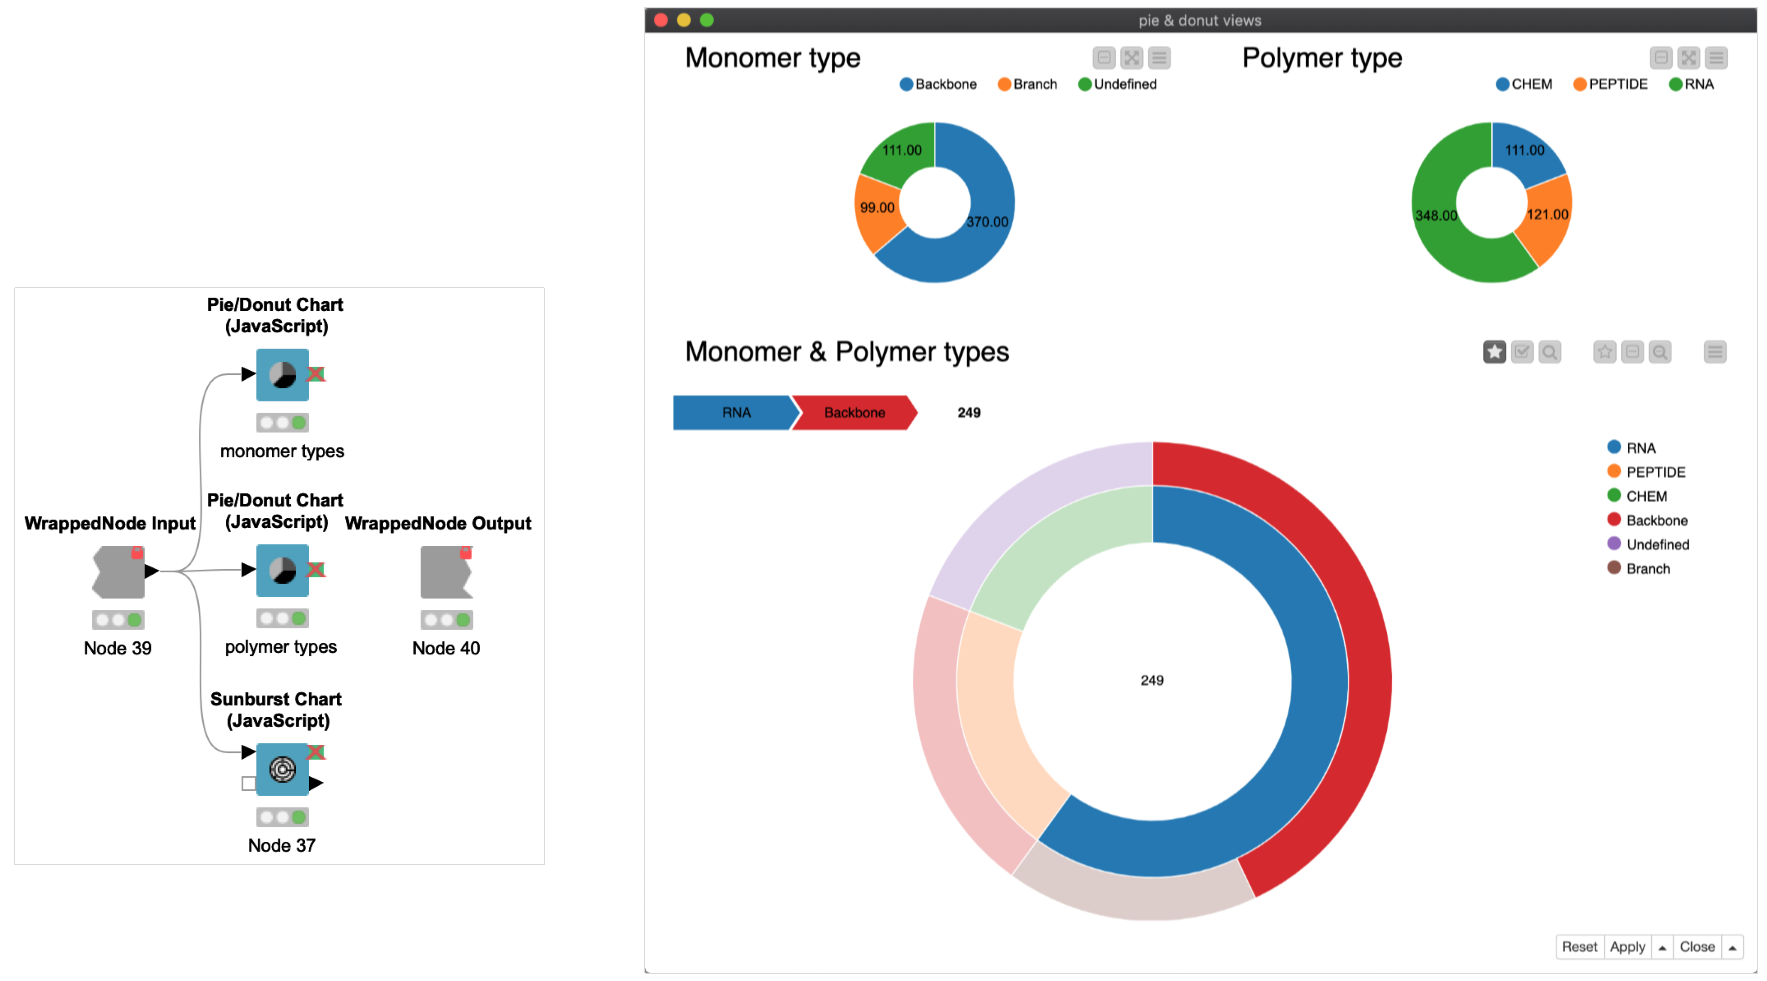
Once the library has been organized in a table structure, computing statistics and creating visualizations is quick work. In this example, simple aggregate count statistics and preparation on the MonomerType and PolymerType fields were calculated within a collapsed metanode ‘aggregate & prep’, and visualized with several JS View nodes within a component ‘donut & sunburst views’ (Figure 4).
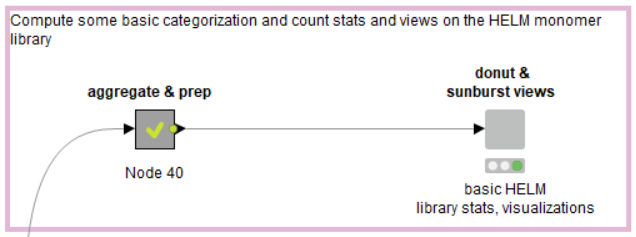
Combining JS nodes in a component allows for quickly compositing dynamic, interactive graphics as HTML; this can be viewed as a local output window or, when supplemented by KNIME Server, within the KNIME WebPortal (Figure 5).
Monomer structure visualization and metadata table or tile display
Key points:
Key points:
- Use ‘Molecular Type Cast’ node to convert mol string to mol.
- PNG display using ‘Renderer to Image’ node.
- Flexibility of KNIME for achieving molecular visualization.
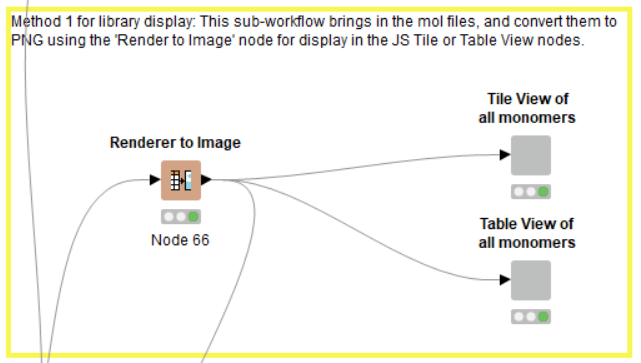
After conversion of the column containing the mol string to an actual MOL-formatted column using the ‘Molecule Type Cast’ node, we are one step closer to visualization of the monomer structures. This workflow demonstrates one particular method for accomplishing this (Figure 6), although there are many possible routes, highlighting the versatility of the KNIME platform and the plethora or cheminformatic-focused node sets at its disposal. At the end of the day, users can and should utilize elements in ways that are fit-for-purpose for the situation at hand.
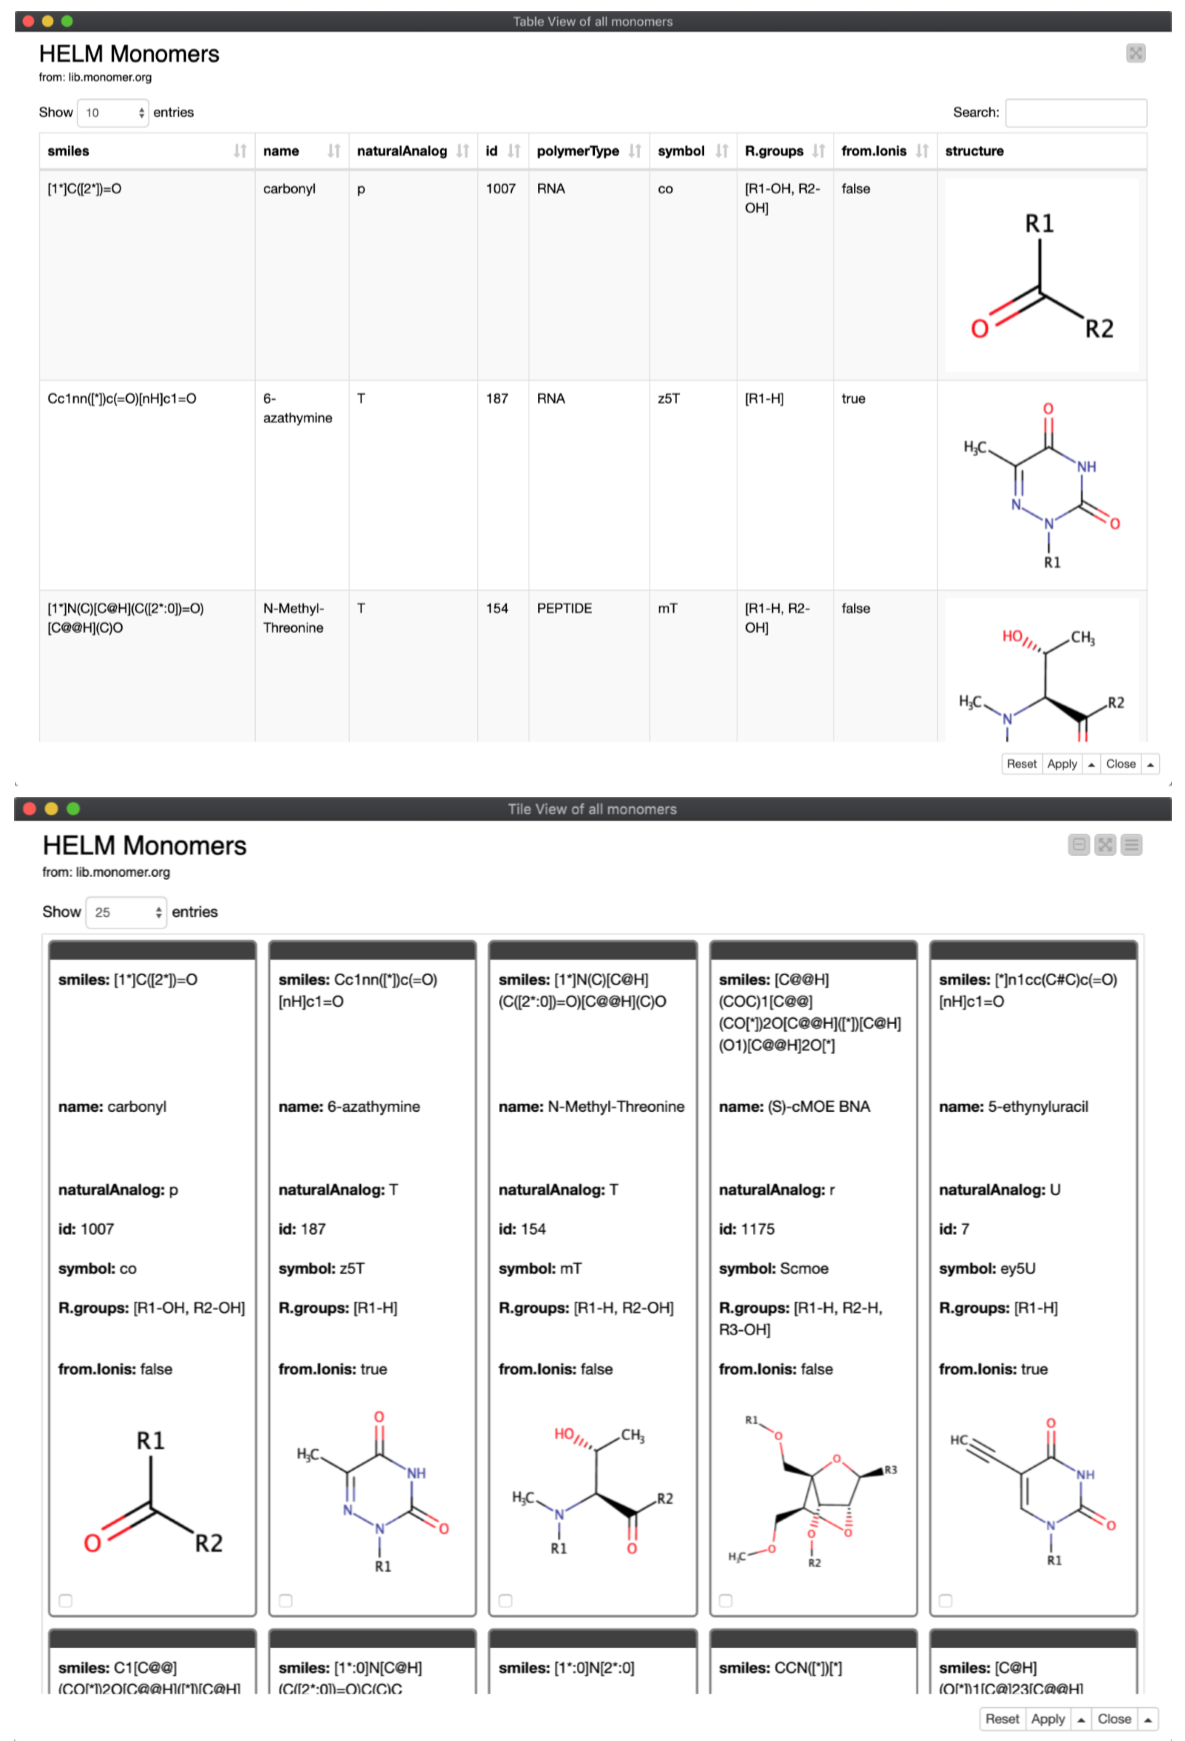
The powerful ‘Renderer to Image’ node converts the structures from the MOL-format to a PNG image. In the configuration window for this node, we select the PNG image-type, with a 200 x 200 point resolution; this was arrived at after some trial and error (i.e., to establish what ‘looks good’ in the final output, and is not prohibitively large or small). Finally, the structures as images and their related metadata are presented as HTML views coming from component containing either a JS Table view or a JS Tile view (Figure 7). These elements are fully text-searchable, and can be configured further for within-column search, the ability to make and publish selections, etc.
Guided analytics for substructure search and display
Key points:
Key points:
- Substructure entry using the ‘Molecule String Input’ node.
- Substructure search using CDK nodes.
- Table display of search results.
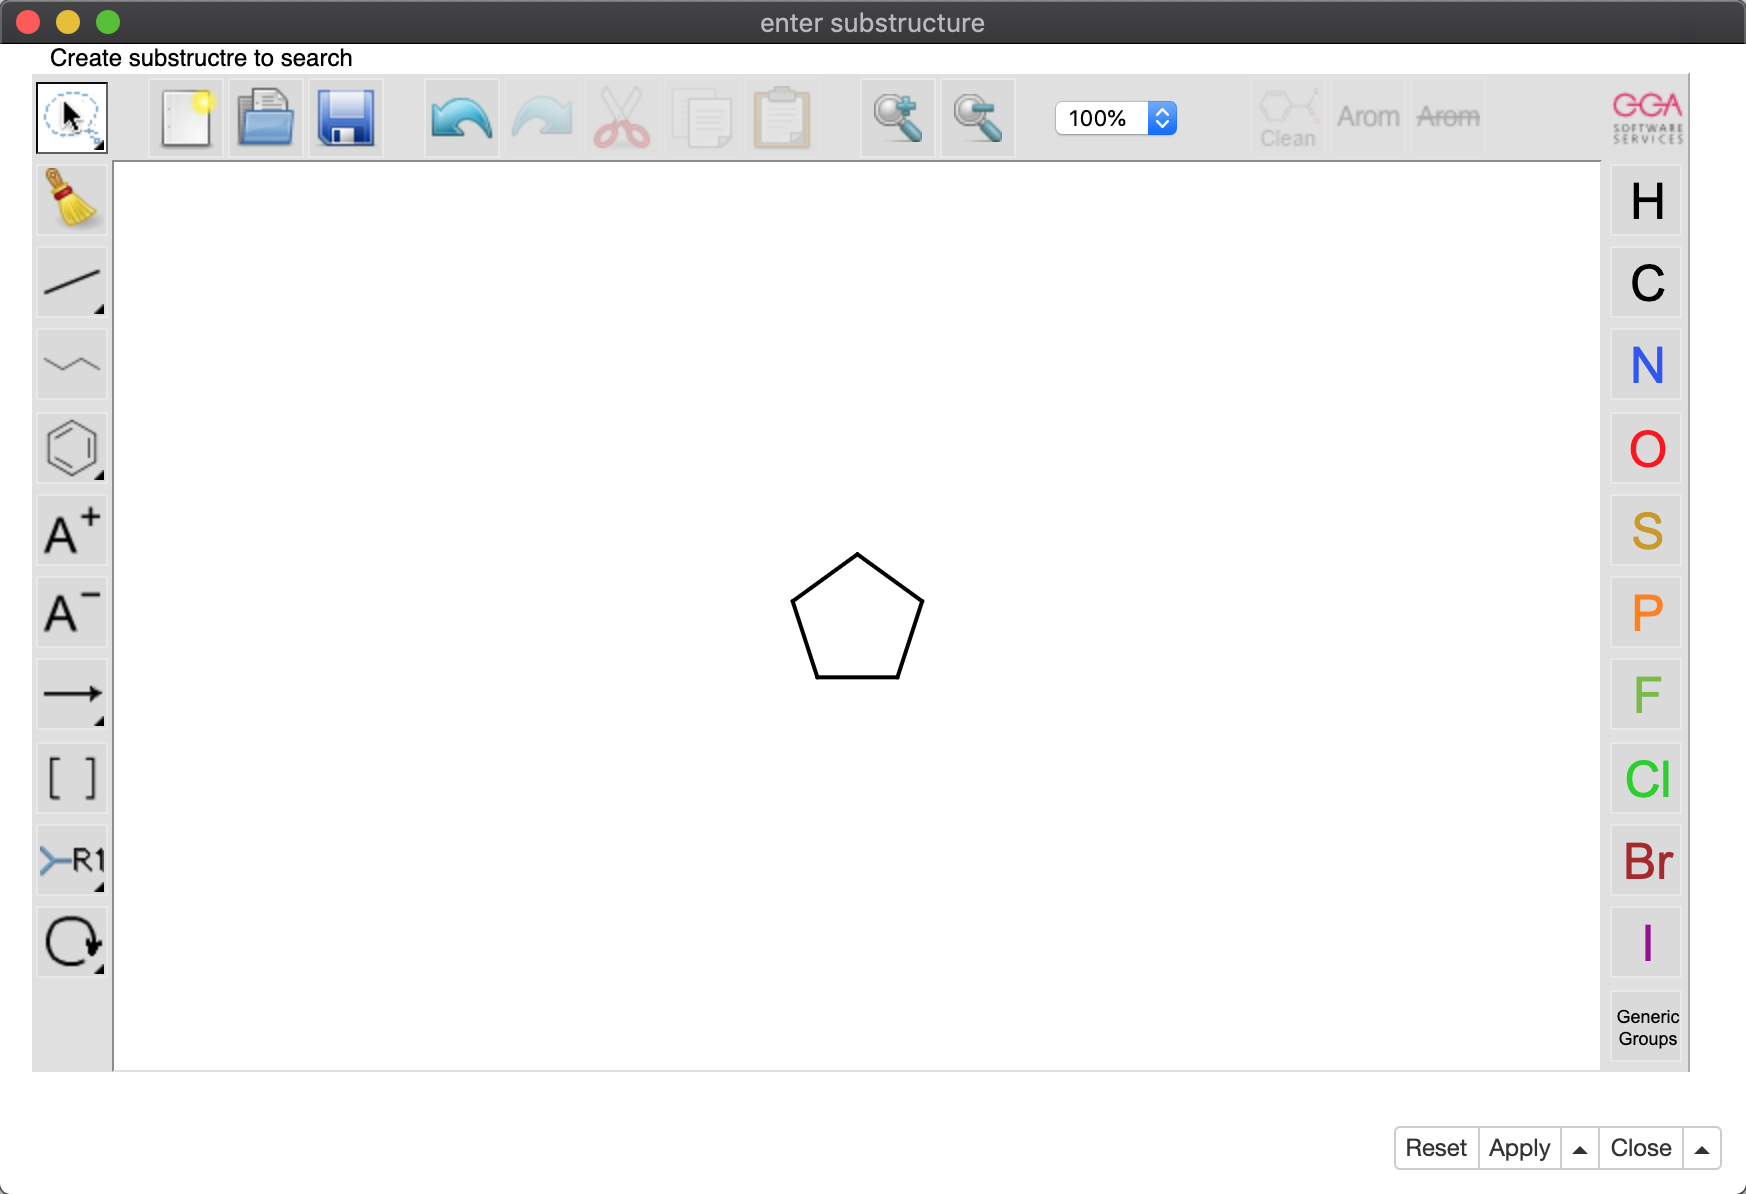
The last piece of the workflow is an example of Guided Analytics: the user specifies a chemical structure with which to perform a substructure search of the library, which returns ‘hits’ in a component containing a JS Table view (Figure 8).
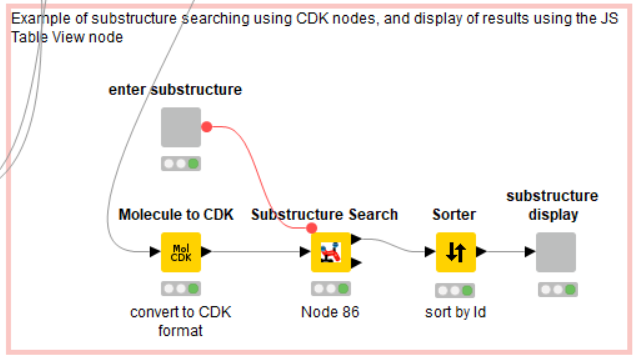
The substructure is drawn and entered by the user with the ‘Molecule String Input’ node; in this example, a pentane ring (Figure 9). The actual search is performed by the ‘Substructure Search’ node from the CDK node set; the substructure is passed into this node as a flow variable. Note that the library MOL format first must be translated into CDK format using the ‘Molecule to CDK’ node.
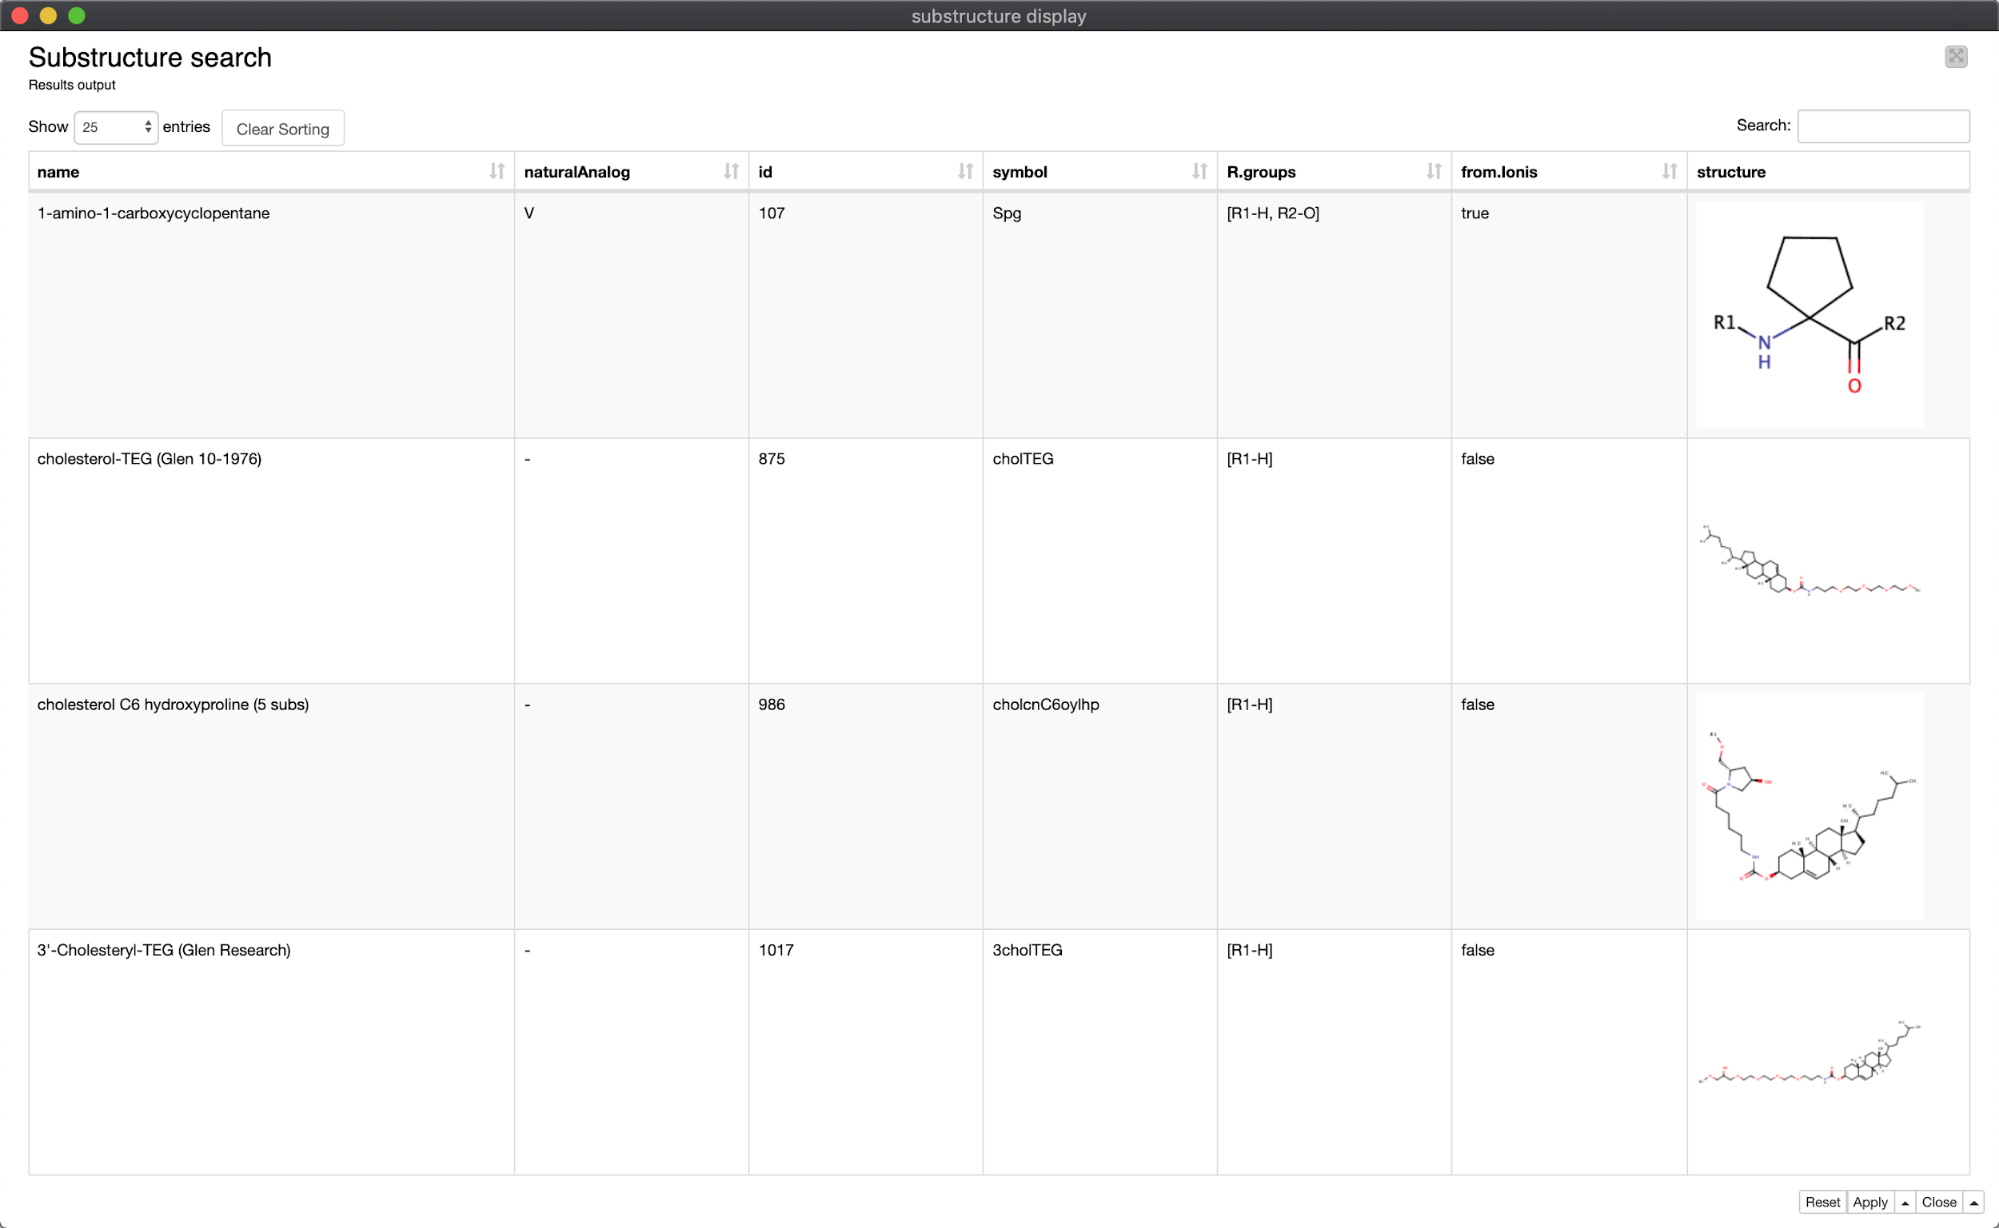
The result of the pentane substructure search is a subset of 26 molecules, rendered in searchable table format using a component containing a JS ‘Table View’ node (Figure 10).
Conclusion
Using KNIME Analytics Platform, the concept of accessing and investigating the HELM monomer library was translated and assembled very quickly. The resulting workflow exemplifies several powerful and easy-to-use features of KNIME Analytics Platform, including:
- An intuitive user interface with node-type workflow assembly
- Web REST API support
- JSON parsing and manipulation functions
- Integration with cheminformatics tools supporting chemical language translation
- Guided analytics for user-driven substructure input, searching and viewing
- The ability to build components that deliver dynamic Javascript-enabled graphs and tables
Perhaps most importantly, this workflow5 and its contents have been made accessible via this blog and the KNIME Hub, a new collaboration and learning space for the KNIME user community. Anyone with an internet connection and KNIME Analytics Platform can download and execute this workflow anew, retrieve the HELM library, perform novel chemical searches of its contents and view the tabulated results.
- Download and try out the workflow 'Accessing the HELM Monomer Library' from the KNIME Hub here
Users can:
- Investigate the workflow to gain some intuition on its function
- Expand on its capabilities through their own augmentations of the code
- Communicate these ideas back to the community
Furthermore, users with access to KNIME Server have the ability to view the outputs of components in their browser via the KNIME Webportal, highlighting the ability to deliver interactive services to broader communities of users who may not be familiar with coding.
References
1. Zhang et al, 2012, ‘HELM: a hierarchical notation language for complex biomolecule structure representation’, Journal of Chemical Information & Modeling
3. Milton et al, 2017, 'HELM Software for Biopolymers', Journal of Chemical Information & Modeling
5. Download and try out the workflow 'Accessing the HELM Monomer Library' from the KNIME Hub here