The strategy online pharmacy companies use to acquire customers and grow their market share is extremely competitive pricing. It’s a strategy that seems to be working. Over the next 5 years, this market is expected to grow at a compound annual growth rate (CAGR) of 17.26%, according to the Online Pharmacy Market Forecast Report.
We asked ourselves, just how competitive are online pharmacies? How big is the discount offered by the “Big 6” German online pharmacies from the pharmacy retail price (AVP)?
To answer this question, we need to combine knowledge from different areas of data science: we will obtain the data through web scraping, merge and prepare the obtained data in databases, analyze the data and visualize the results.
One of the nice things (but sometimes a challenge) about data science is that there are almost always multiple ways to solve the problem. When we manipulate data from a database, for example, we can do it with SQL, with Pandas, with Tableau Prep, or with KNIME. The advantage of KNIME is that it covers the entire data science process and enables the data scientist to easily combine different data science tools.
Therefore, in this article we would like to show you how we analyzed the prices of the Big 6 online pharmacies in Germany with KNIME and easily integrated a range of data science tools in KNIME to automate our analysis.
Scrape with Python, Store in MySQL, Visualize with Tableau, All within KNIME
To gather, load, manipulate, transform, and visualize the data from our online pharmacies, we use the following tools: Python, MySQL, and Tableau with KNIME. Let’s have a look at how we can:
-
Use KNIME (Server) and a Python script integrated in KNIME to automatically scrape the prices of articles from several webshops.
-
Write them with KNIME into a MySQL database.
-
Aggregate them there and form key figures with In-Database processing.
-
Prepare them for visualization in Tableau.
And the whole thing with two KNIME workflows!

The Questions to Answer in our Analysis of the “Big 6” German Online Pharmacies
To answer the question of just how strong pricing pressure is among online pharmacies, we analyzed the prices of the Top 200 over-the counter (OTC) medicines in Germany. Over the counter medicines are those medicines that can be bought in a pharmacy without a prescription.
Abbreviations used frequently in this article:
- OTC refers to medicines that can be bought without a prescription over-the-counter
- AVP is the recommended pharmacy retail price
- PZN is the pharmaceutical central article number
The prices of these 200 products are collected directly on a daily basis from six large German online pharmacies – the "Big 6". In addition, the prices for these 200 items are collected as offered through the best-known German pharmaceutical price search engine "Medizinfuchs". In addition to a three-digit number of German online pharmacies, the Big 6 are also represented in this price search engine. In this way, the following questions can be answered:
-
How big is the discount off the recommended retail price (AVP) offered by the Big 6?
-
How big is the discount off the recommended retail price (AVP) offered by pharmacies listed on Medizinfuchs?
-
How much does the discount of the Big 6 offered in their own webshops differ from the discount offered when a customer reaches their webshop via Medizinfuchs?
Note. KNIME Server is perfectly suited for the automated execution of scraping scripts (e.g. via Beautiful Soup). In combination with a MySQL server, a solution can be created that generates a steady flow of data without any intervention on your part.
Walk-through of the Workflow: Price Analysis of Online Pharmacies
The workflow is divided into four steps:
Step 1: Scraping prices from different sources
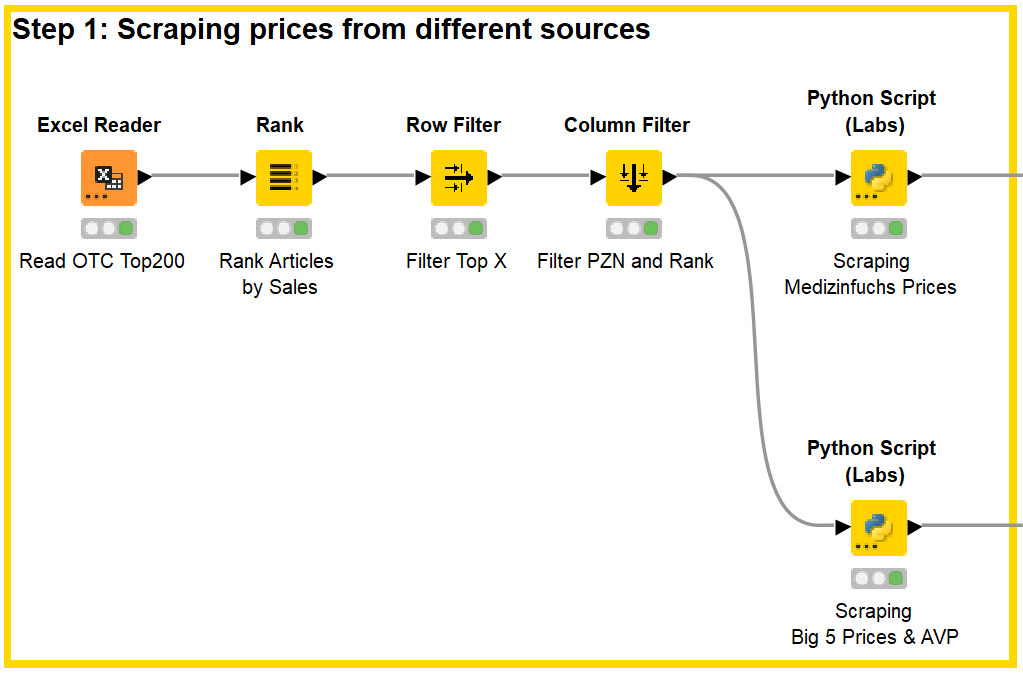
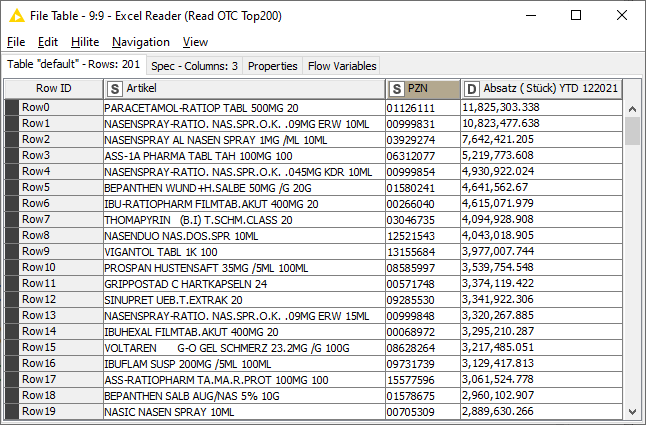
In the first step, an Excel list with the sales data (Fig. 1) of the OTC Top 200 is read into KNIME and ranked according to sales. A filter can then be used to decide to what extent the top articles should be scraped.
The article numbers of these medicines, the so-called Pharmaceutical Central Number, abbreviated to PZN, are then passed to the two Beautiful soup scripts in the Python nodes.
In order to run Python scripts in KNIME Analytics Platform and on the KNIME Server, a few steps are required in advance:
-
In KNIME Analytics Platform on the local machine, the KNIME Python Integration must be installed and configured as described in the KNIME Python Integration Guide.
-
Likewise, KNIME Python Integration must be installed and configured on the KNIME Server. My recommendation would be to work with Anaconda in both cases, i.e. Anaconda should be installed in advance on both the server and the local machine.
-
Next, the Python installation on the server must be adjusted to the local Python installation, i.e. the Python settings in the Executor Preferences must be adjusted accordingly. According to the KNIME Server Administration Guide, the KNIME Preferences must be exported and the lines in this exported file that refer to Python must be copied to the corresponding KNIME settings on the server after adjusting the file paths.
-
Possibly, the knime.ini file may need to be modified.
-
Also, make sure that all Python packages required in the Python scripts are installed not only on the local computer but also on the server.
This forum post summarizes the procedure quite well.
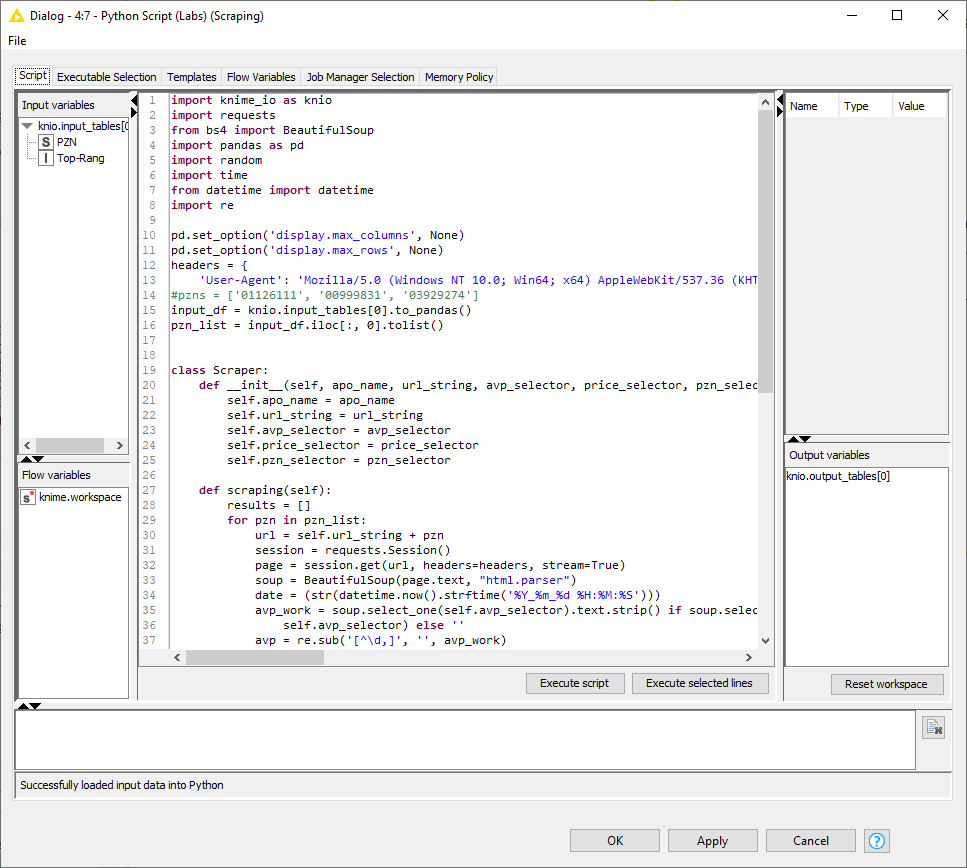
Please note the following two lines:
In these, the KNIME table becomes a Pandas dataframe, which in turn is transformed into a list from which the PZNs to be scraped are read.
The next figure shows the result of the Big 6 Scraping – the results of the Medizinfuchs Scaping are similar, except that here the price information of approx. 100 pharmacies is listed for each PZN.
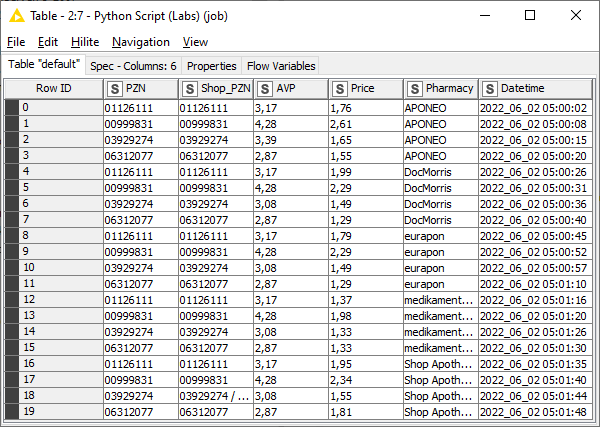
In the next step, the price data is prepared before it is written to different databases.
Step 2: Preparing the scraped price data and writing it to multiple tables in a database
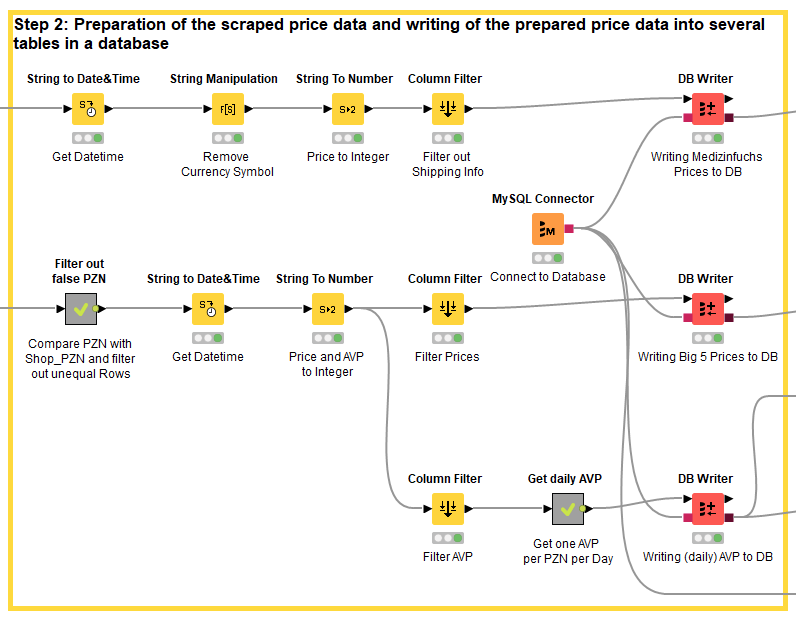
One point is quite interesting to note here:
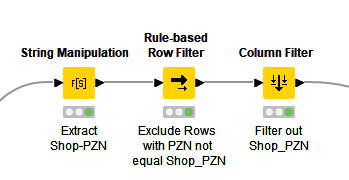
In some cases, a particular PZN article number, i.e. a particular item, is not in stock on a particular day at the respective mail-order pharmacy. Some online pharmacies then automatically direct you to a pack size of that item that is in stock. The scraper does not notice this and takes the wrong price. To avoid this, the PZN of the article is compared with the PZN with which the article web page was originally called. If both do not match, the line is deleted.
The two databases for the prices of the Big 6 and the pharmacies listed on Medizinfuchs basically contain only three columns: PZN, price and datetime.
With the recommended pharmacy retail price, the AVP, it is a bit more complicated: Medizinfuchs does not show a real AVP and not all of the 200 articles are available in the Big 6 pharmacies on every day, so that the AVP is also missing here in some cases. However, in order to make comparisons, this is needed for each day and for each PZN. The problem can be partially solved with a series of Column Merger nodes, that merge two columns into one by choosing the non-missing cell.

However, it is still possible that an item might not be available from the Big 6 pharmacies on a particular day, but will be available from the more than 100 pharmacies listed on Medizinfuchs. To finally solve the problem, the entire AVP data, one for each day for each PZN, is read out in step 3 and the missing values are imputed.
Step 3: Formation of key figures and merging the key figures from the different database tables
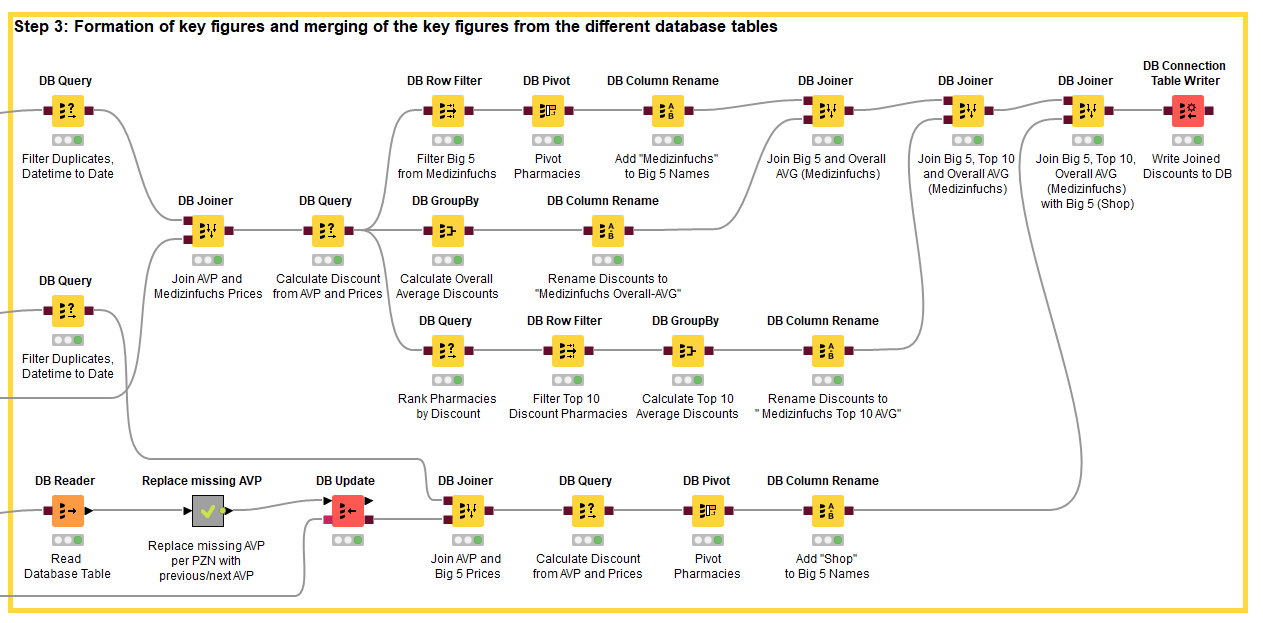
You can see that in Step 3, the work is done almost exclusively In-database. With large amounts of data, this generally brings advantages, but not all nodes in KNIME are also available as “DB-Nodes”. Here you have two possibilities: Either you write your own SQL query in KNIME (like in the DB Query Node “Rank Pharmacies by Discount”) or you read the contents out of the database into a KNIME table. With the latter method you lose the speed advantage, but you don't have to deal with complicated SQL queries ;-). In the workflow you can see how a SQL query for replacing missing values is bypassed this way and instead the missing value nodes of KNIME are worked with.

Since the node for imputing missing values works with the rows of a column, the PZNs (the article numbers) must first be pivoted from the rows to the columns and after the imputation the pivoting is undone again.
For each day and each PZN, the prices of the Big 6 are now combined with the (complete) daily AVP and the respective discount on the AVP is calculated for each of the Big 6 pharmacies.
The same happens with the prices of the pharmacies listed on Medizinfuchs. However, here the following operations are still performed:
-
The average discount of all pharmacies listed on Medizinfuchs is calculated for each day and for each PZN, .
-
Likewise the average discount of the ten cheapest pharmacies.
-
And finally, the average discount granted by the Big 6 pharmacies on Medizinfuchs.
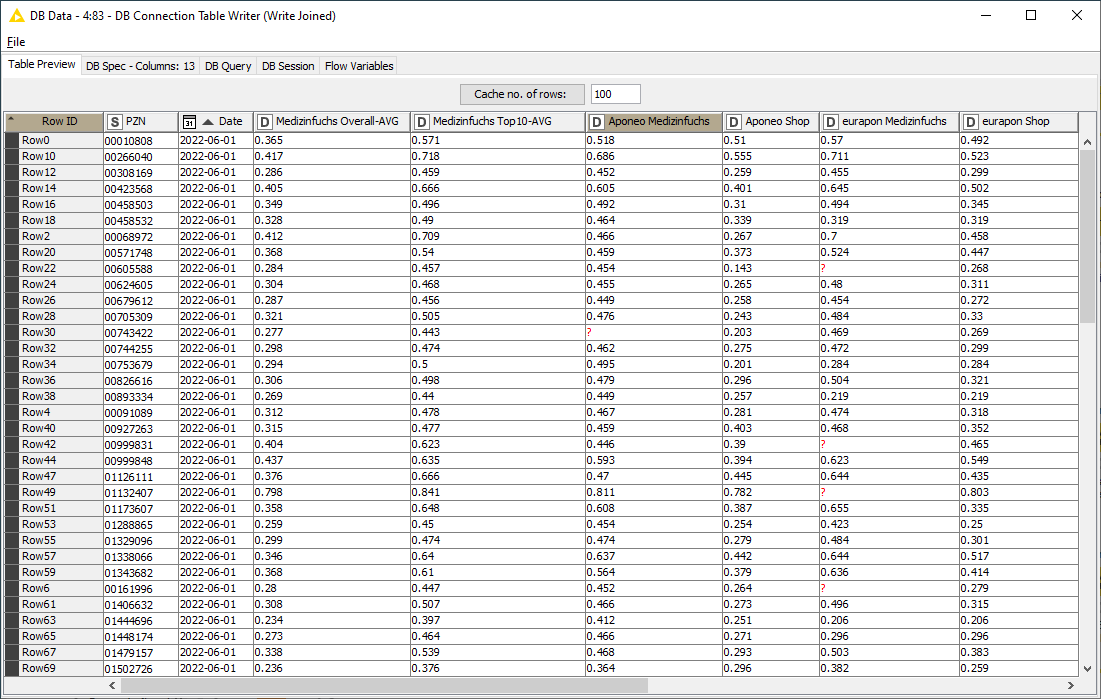
As a result, the following price information is compiled for each day and for each PZN:
-
Discount of the Big 6 in their own webshop
-
Discount of the Big 6 on Medizinfuchs
-
Average discount of all pharmacies on Medizinfuchs
-
Average discount of the ten cheapest pharmacies on Medizinfuchs
Now for the last step!
Step 4: Preparation of the merged key figures and visualization in Tableau

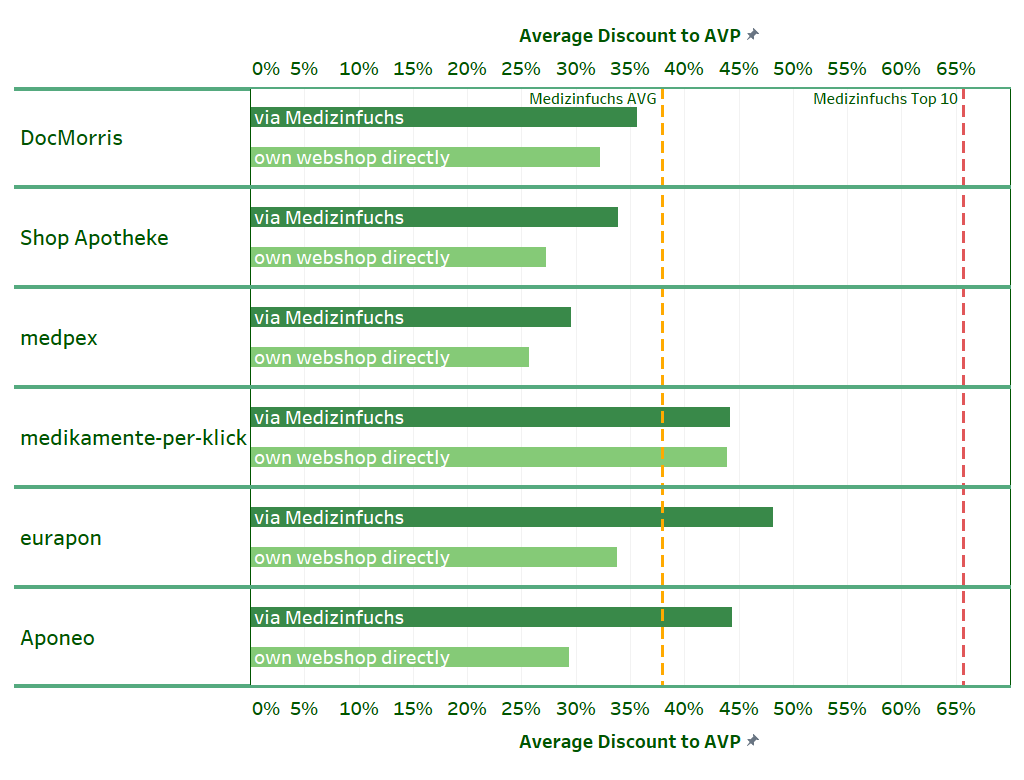
Since the key figure generation and preparation of the data for Tableau does not have to take place on a regular basis, the last step takes place locally in KNIME Analytics Platform in a separate workflow. This workflow accesses the database into which the discount results were also automatically written in step 3. First, the average discount over time for the Big 6 in the own webshop and via Medizinfuchs as well as the average discount of the ten cheapest and all pharmacies on Medizinfuchs are formed in-database. Subsequently, the table is modified slightly to improve the display in Tableau. The result is the following visualization:
Exploring the Visualization: Medizinfuchs Offers the Biggest Discount
You can see in the visualization that the Big 6 – with the exception of medikamente-per-klick – make an effort to offer more attractive discounts in the price search engine.
Only with this larger discount do some of them manage to be at least as cheap as the average of the pharmacies listed on Medizinfuchs. In their own webshop, the Big 6 also give a discount, but it is smaller.
One exception is medikamente-per-klick. This online pharmacy does without a more attractive price search engine discount and is basically cheaper than the average of the online pharmacies listed on Medizinfuchs.
We can also see that the largest online pharmacies in terms of turnover (DocMorris, Shop Apotheke and medpex) tend to act rather cautiously in terms of discounts, while the smaller providers (Aponeo, eurapon) grant higher discounts when ordering via Medizinfuchs. Our analysis shows, whoever, that none of the Big 6 pharmacies offers such high discounts as the Medizinfuchs Top 10!
Easy Integration of Data Science Tools in KNIME
The goal of this article was to show how easy it is to combine different data science tools with KNIME. We combined Python, MySQL and Tableau.
The learnings from combining KNIME with Python are that regardless of whether automated with KNIME Server or partially automated with KNIME Analytics Platform, it is easy with KNIME to run a Python script – in this case a Beautifulsoup Scraper – automatically and write the raw data into a database. Alternatively, the raw data can be written to an Excel or csv file.
Using MySQL and KNIME, we found that data preparation and key figure formation afterwards is also very convenient with KNIME, whether In-database or Out-database.
Our experience with Tableau showed that are also different ways to provide Tableau with the prepared data: Either as in the example via a hyper-file. Or alternatively into a file or database that Tableau can access. If a Tableau Server is available, the data can also be sent directly to it with the Tableau Server Node, so that all Tableau users can work directly with the latest data.
Tip: The results can also be written directly to Google Sheets with KNIME. If Tableau gets the data from there, then you can work with an automated workflow that automatically provides the Tableau user with the most current data - this even works if the end user only uses the free Tableau Reader.
