This is part of a series of articles to show you solutions to common finance tasks related to financial planning, accounting, tax calculations, and auditing problems all implemented with the low-code KNIME Analytics Platform.
Companies rely on a set of standard Key Performance Indicators (KPI) metrics to measure the health of their business. KPIs measure revenues, employee retention, customer satisfaction, n brand awareness, auditing, and more.
Many of these KPIs are already included in many commercial tools, like CRM for customers, ERP systems for revenues, or HR platforms for employees. Finance teams could gain a truly comprehensive view of the company's status if they were able to calculate all their KPIs from different sources and display them all in the same report, dashboard, or shareable dataapp.
In this article, we want to learn what the revenue growth KPI is and how to calculate it automatically with KNIME. Using KNIME, as a data science tool, gives us access to techniques to collect all our data from disparate sources and build that comprehensive view of the company's status.
Watch the video below to get a summary of the solution and find a detailed write-up of the KNIME solution below.
The task: Calculate revenue growth KPI
Revenue Growth KPI measures the increase in revenues from one period to the next. It's the most common KPI used by CEOs to explain the status of the business.
If we consider a particular business year, the period we want to measure could be month, quarter, or even day. Month is the most commonly adopted period for Revenue Growth KPI calculation.
Revenue growth rate is defined as:
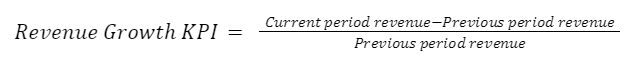
If we take a typical journal in a finance department, we see a list of sales and expenses, accounted for respectively in the “credit” and the “debit” column. The revenues are the amounts in the “credit” column.
Both amounts, for debit and for credit, correspond to the original amount reported in the invoice or in the sale contract converted to the company adopted currency. Our data then comes from at least two sources: the company’s entry journal on an ERP system, e.g., SAP, Odoo, Excel files, etc., and an external service for the daily exchange rate.
If invoice documents and sale contracts reside on different platforms, the number of data sources might increase. The process, however, does not change. That is:
- Pull the journal entries from the ERP system.
- Collect the exchange rates from an external service
- Multiply the original amounts by the date’s exchange rate and populate the “credit” / “debit” columns.
- Aggregate the credit entries (i.e. revenues) by the selected period. Let’s build a monthly KPI here, with period = month.
- Calculate Revenue Growth KPI.
- Visualize the KPI.
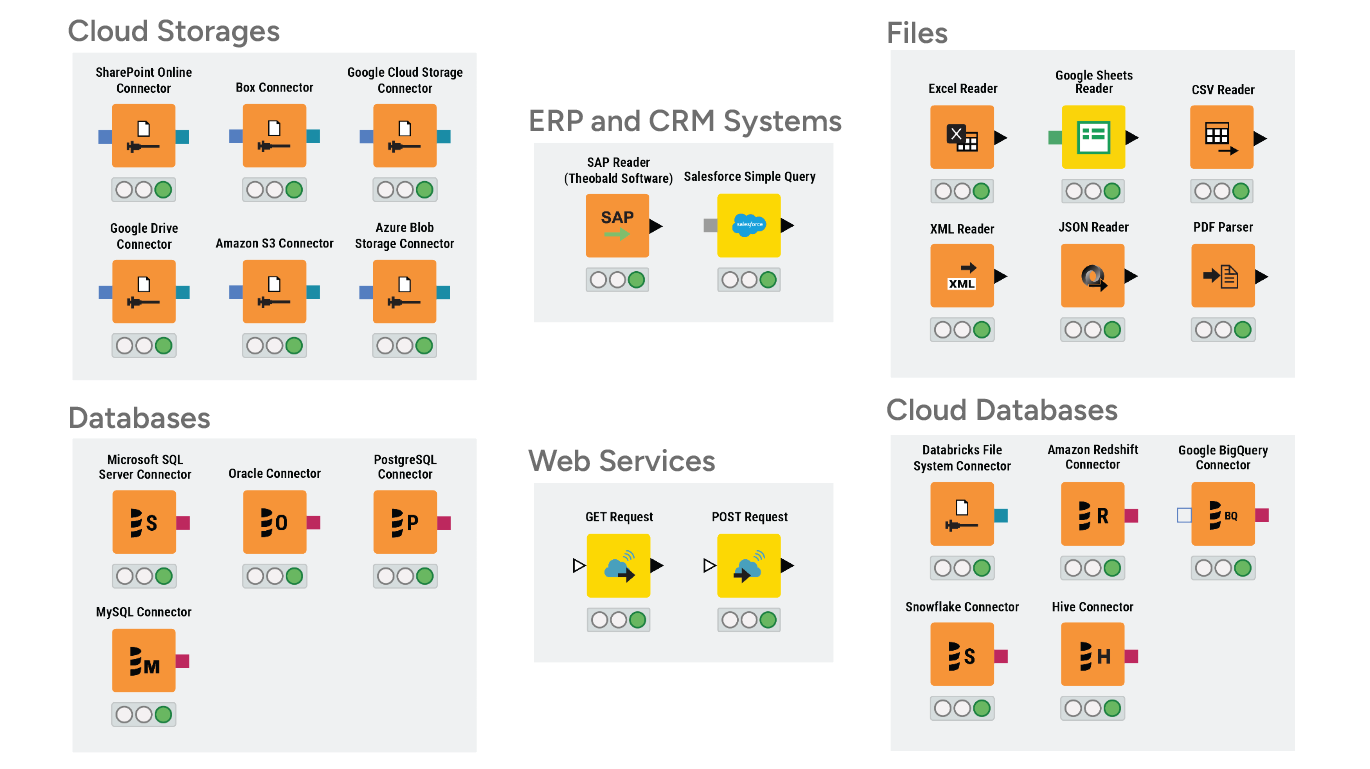
Thanks to the many connector nodes available within KNIME Analytics Platform, native as well as developed by the KNIME Community, the journal entry data could be pulled out of SAP using the SAP Reader node, out of Odoo using the GET Request node, out of a database using the DB nodes, or simply out of an Excel file using the Excel Reader node.
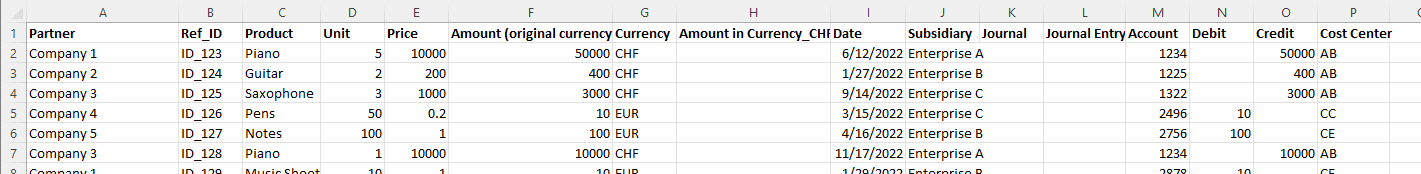
In order to make this example work on everybody’s laptop, without the need of accounts and credentials, we used an Excel file as our accounting journal in the finance department.
Below is a screenshot of the simulated journal entry data that we used for this use case.
The workflow: Calculate monthly revenue growth KPI for a fixed year
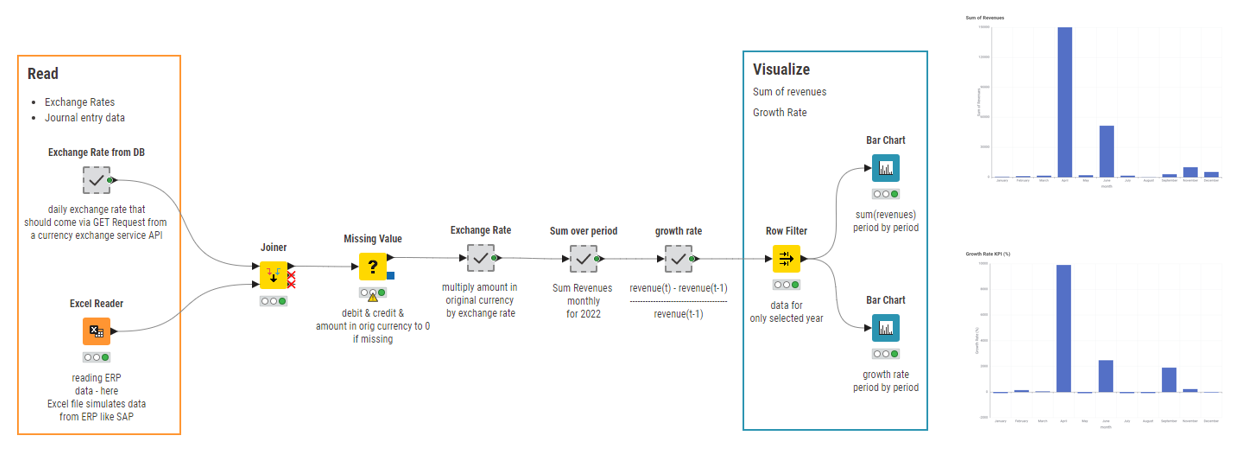
The simplest solution workflow Revenue Growth KPI Monthly Static is available and free to download from the KNIME Community Hub. With this workflow you can:
- Read journal entry data from SAP, Salesforce, or an Excel file with the appropriate reader node. In our example, we used an Excel file.
- Collect the exchange rates via REST API to an external service. Since many exchange rate API services are for payment, we simulated the service in this workflow with an SQLite database.
- Join the two data tables – journal entries and exchange rates – by date to obtain one single global data table.
- Fill the missing values in “credit” and “debit” column with 0s via the Missing Value node (we assume that no payment or no sale was made if the item is not present in the column).
- Adjust the amount in “credit”/ ”debit” according to the exchange rate, where needed.
- Aggregate Revenues monthly.
- Calculate Revenue Growth KPI
- Visualize the KPI via bar chart for a specific year
The data app: Generate dynamic visualization of KPI by year
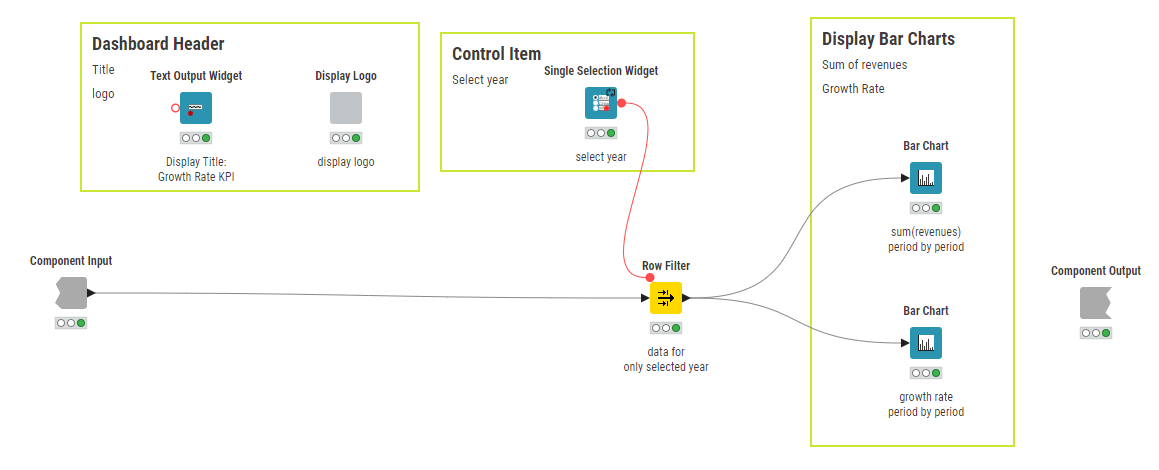
The previous solution is quite simple and already does what is expected. Let's now create a dashboard from the two bar charts and add a title and logo. We do this by wrapping the relevant nodes into a component, which we'll call our “data app”.
The nodes we'll need for our data app are:
- The two bar chart nodes and the Row Filter node that selects the year
- A Text Output Widget node to give the dashboard a title
- The “Display Logo” component, to show a logo image in the dashboard
Note. Components are a powerful feature of KNIME Analytics Platform. While in theory they are just nodes that contain other nodes, in practice, by inheriting the views of the graphical nodes within, they produce powerful dynamic interactive dashboards.
Now, let’s make the selected year for the visualization a dynamic parameter of the data app. We introduce a Widget node (“Single Selection Widget”), to include a drop-down menu for the year selection in the data app view. We can then use this parameter, i.e. the selected year, to control the Row Filter node before the KPI visualization.
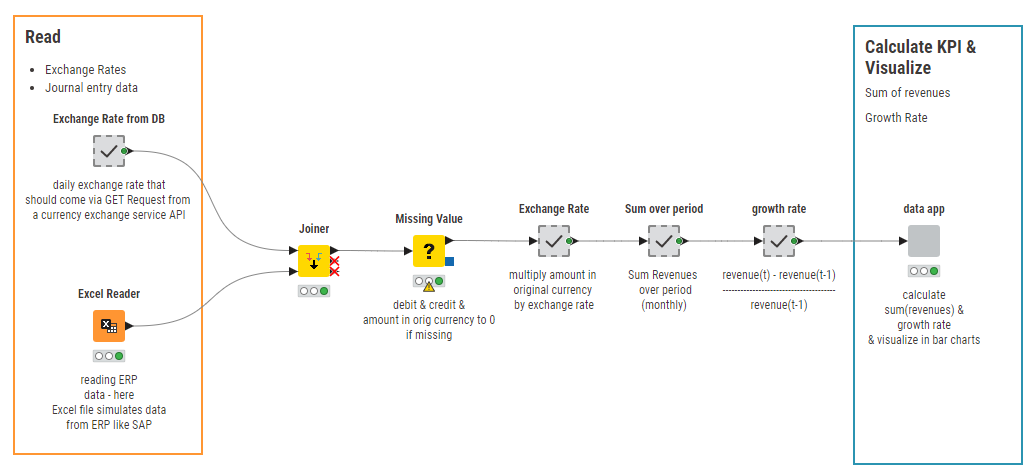
The final workflow Revenue Growth KPI Monthly (shown below) is available and free to download from the KNIME Community Hub. This workflow has the same core as our simpler workflow, Revenue Growth KPI Monthly Static. However, here the Row Filter node, and therefore the KPI visualization, is controlled by the Widget node for the year selection (pictured above).
The results: Explore revenue growth KPI with interactive data app
In this workflow we have assembled a data app, not only to calculate the monthly Revenue Growth KPI, but also to display it dynamically based on the user selection of the year. The gif in Fig. 6 shows the data app in action as controlled by the end user.
Could we have performed the same task with Excel? If we limited ourselves to a static representation of the KPI, surely, we could have. However, this implementation offers a few added benefits:
- A dynamic data app allows the user to interact with the dashboard, more plots and charts from other KPIs could also be added to make the business overview more comprehensive, and it can be shared easily with colleagues.
- The possibility to connect to external sources via REST API (GET Request node) or to database (DB nodes) or to specific ERP systems (SAP Reader node or other similar nodes)
- And, of course, automation. When input data changes the workflow continues to calculate the KPI correctly without needing to adjust macros and rows in the spreadsheet.
This content is also available as a YouTube video KNIME for Finance - Revenue Growth KPI.
KNIME for Finance
KNIME Analytics Platform is an open-source free low code platform. Thanks to its visual and intuitive user interface, you can implement solutions without having to learn to program first. KNIME's user-friendly environment makes it easier to access sophisticated data science techniques which you can use to help with automation, blending data, building parametric dashboards. This analytic depth and breadth also sets the stage for you to try more complex projects such as building predictive models, or integrating AI.