When implementing a data-based application, designing its architecture is as important – if not more – as the implementation itself. While the single implementation steps are responsible for the final correctness of the results, the application architecture will lay the basis for an efficient execution.
In this article, we’re going to show how to design an efficient application architecture. To demonstrate the importance of a good application architecture, we'll use a case study described in a previous blog post Six CEO KPIs and how to measure them.
- We'll develop the application in KNIME Analytics Platform, a free and open-source data science tool to build visual workflows
- We'll deploy and scale how the application can be used across the organization with KNIME Business Hub
The case study: 6 KPIs for a CEO
That CEO KPIs blog post described a very common task: calculating and displaying six KPIs commonly used to assess the health of a business. Three KPIs described the revenue situation and three KPIs described the health of the company itself. You can check the formulas of the KPIs and the details of their implementation in that blog post.
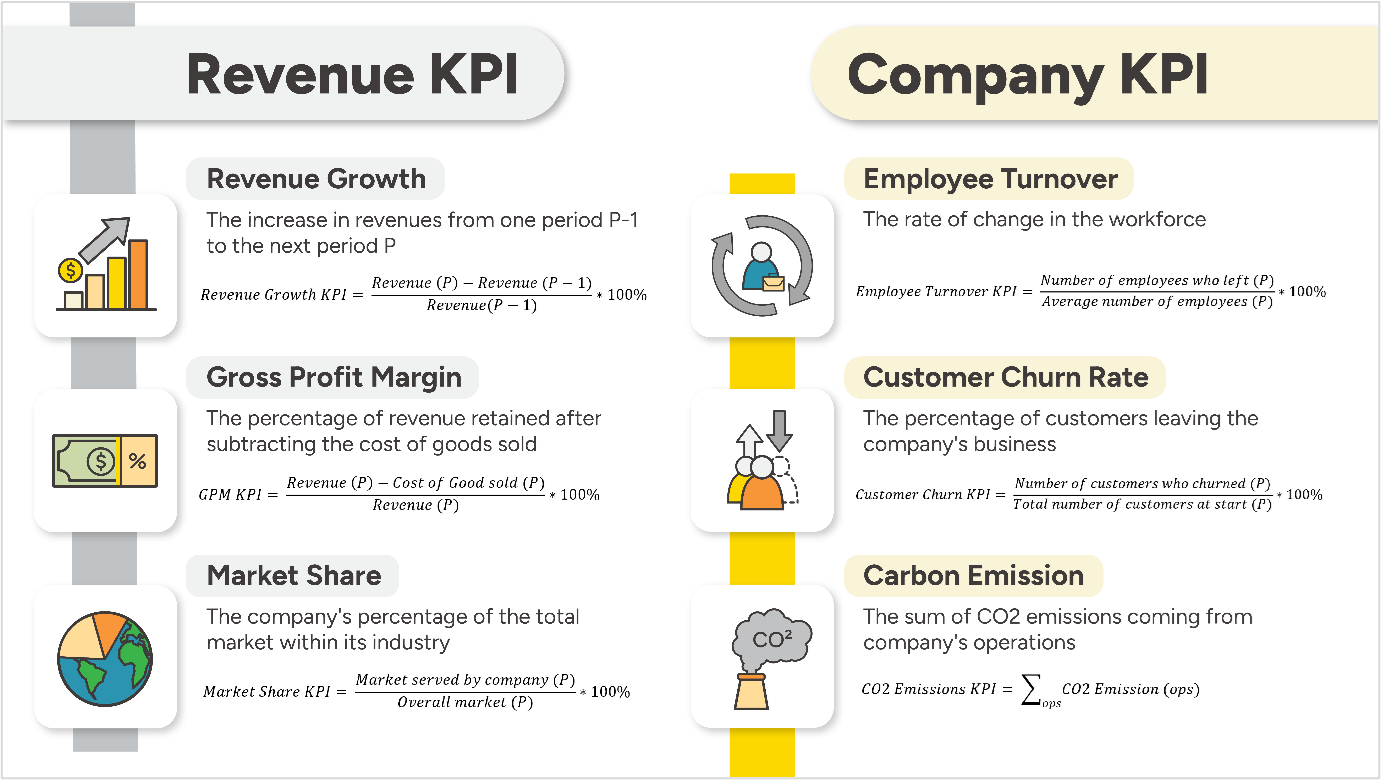
In this blog post, we would like to focus on the architecture of the whole application and the reasons that led us to the chosen structure.
The application implementation is quite simple and requires the following steps:
- Access the raw data, usually from various data sources, and at different points in time
- Calculate the KPIs according to the formulas.
- Visualize the KPIs, zoom in, zoom out, change the time scale, inspect the values, all within a beautiful, interactive dashboard.
- Generate a static PDF report of the dashboard for easy distribution and archiving.
In the era of GenAI, one additional requirement was an AI-based explanation of the values and plots displayed in the report, of how they relate to the company health status including some recommendations for improvements. So let’s add one more step:
- Use GenAI to give an overview of the company status by interpreting the KPI values in the PDF report
The implementation of this last step is described in another blog post Automate KPI Report Interpretation and Insights with GenAI & KNIME.
Let’s assume that all implemented workflows are correct. Let’s talk about how we can ensure an efficient application architecture.
How to design an efficient application architecture
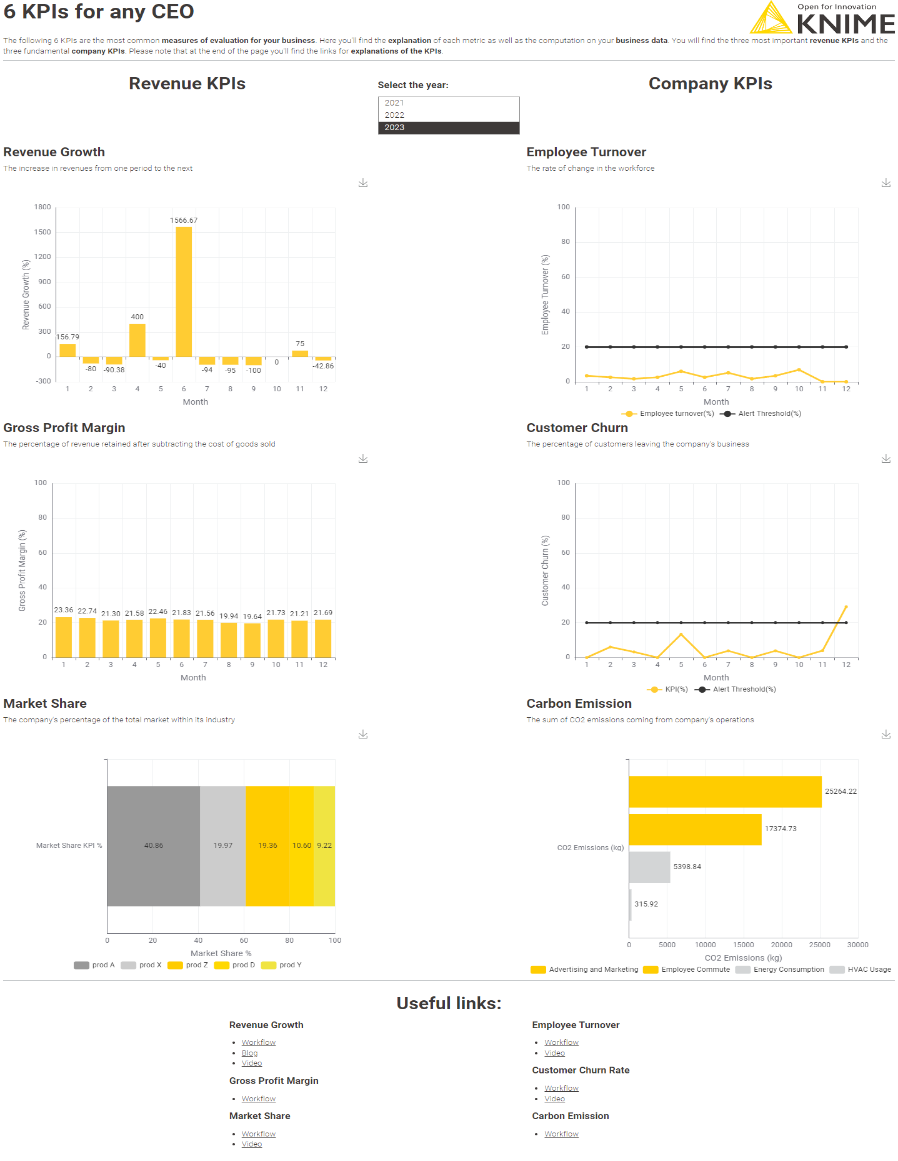
1. Understand how the data application will be used
When designing the application architecture, especially when taking into account its execution efficiency, we need to understand how the application will be used.
There are three key pieces:
- KPI calculation
- KPI visualization
- KPI explanation
In the first attempt, we implemented all three parts together. Within the same application, we calculated the KPI values for all months Year To Date, then we visualized them with a data app, and finally we queried a GenAI engine to generate the explanation. We introduced a few control elements in the data app to display the values for different years. We also introduced the PDF generation functionality for archiving purposes. We then hoped that this application would run once a month, when the new data is available and when the report must be archived.However, consider that:
- There might be more than one consumer of this report.
- The many consumers might want to interact with the dashboard at different times within the same month.
This leads to multiple application executions within the same month and even at the same time. In addition, the end consumer expects the dashboard to run fast, whenever it is launched and refreshed. This requires a light-weight application, with exceptional execution speed.
However, in this original design, every time the application is executed, the KPIs are calculated again, the PDF files are over-written, and the GenAI engine is re-prompted. Every time. This, on one hand, delays the execution significantly, also considering that some KPIs are quite complex to calculate and require a considerable amount of execution time. On the other hand, this can become quite expensive since the GenAI engine is queried unnecessarily at every execution.
It is a waste of time and money to repeat the same unnecessary operations over and over.
2. Group tasks into separate modules
Indeed, best practice would suggest to de-couple the three parts of this application: the KPI calculation, the visualization, and the GenAI-based explanation. The application then consists of three separate workflows.

Workflow #1 populates the data warehouse & creates the PDF report
This first workflow, Writing to a Database: 6 KPIs for any CEO, populates the Data WareHouse (DWH). It accesses a variety of data sources, collects the raw data, calculates the KPIs, stores them into a data repository (i.e. the DWH), and generates the monthly static report in the form of a PDF file.
This is a heavy-duty data engineering type of application, since it has been designed to collect all resource consuming operations. For this reason, it should be run only once a month, regularly, whenever the source data becomes available.
Workflow # 2 prompts the AI for KPI report explanation
The second workflow, Explain KPI Reports with Multimodal LLMs, produces an optional AI-based feature: the AI-generated explanation of the company status based on the PDF report with the 6 KPI charts. This is not a necessary feature, since any CEO should be able to read and interpret KPI trends. However, just in case, the report ends up in non-expert or too busy hands, we provided this optional feature of AI-generated KPI explanation. The end consumers can use it if they want or need to.
This workflow imports the PDF file and with it prompts a GenAI engine for the chart explanations. This workflow also must run once a month, to avoid multiple fee charges by the AI provider, and only after the PDF report file has been successfully generated and stored.
Workflow #3 is a data app for visualization
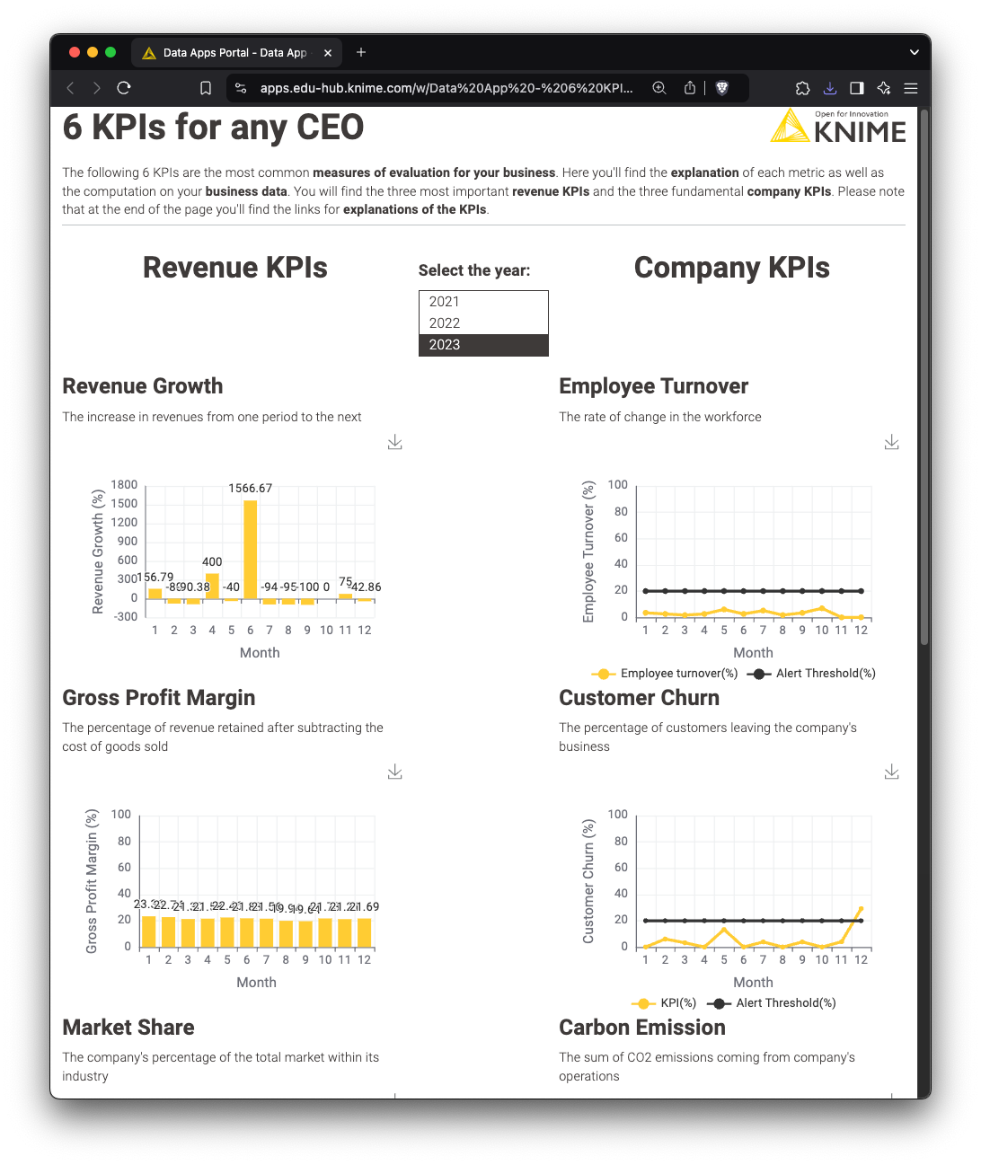
Finally, the last workflow, 6 KPIs for any CEOs: the Data App, accesses the KPI values previously calculated and stored in the DWH, and visualizes them within an interactive dashboard. Unlike the two previous applications, this workflow is made to run multiple times, since many end users can have access to it and might want to run it once or multiple times within the same month. For this reason this must be a light-weight workflow, fast to load and execute, over and over again.
Implementing all resource intensive operations within the first workflow allows us now to implement a lighter and faster application for the visualization part. This is the goal of the data warehouse.
3. Orchestrate how your modules are deployed
We have successfully split the application in three modules: one containing the heavy-duty operations, one relying on a for pay service, and one with fast execution for just the visualization of the results. The part that is still missing is the orchestration of these modules.
However we decide to deploy the modules, as web services or as web applications, we still need to set up their execution schedule (see the table below).

KNIME Hub makes the whole orchestration and scheduling extremely simple. With just a few clicks you can quickly create a scheduling frame for all modules and their scheduling constraints.
4. Schedule application executions at regular times
Once you have uploaded the production application on the KNIME Business Hub or on the KNIME Community Hub and once you have tested that it works as expected, you can now schedule it to run it at regular times.
Click “Deploy”, select the item “Schedule” and select all required time settings (day and time).
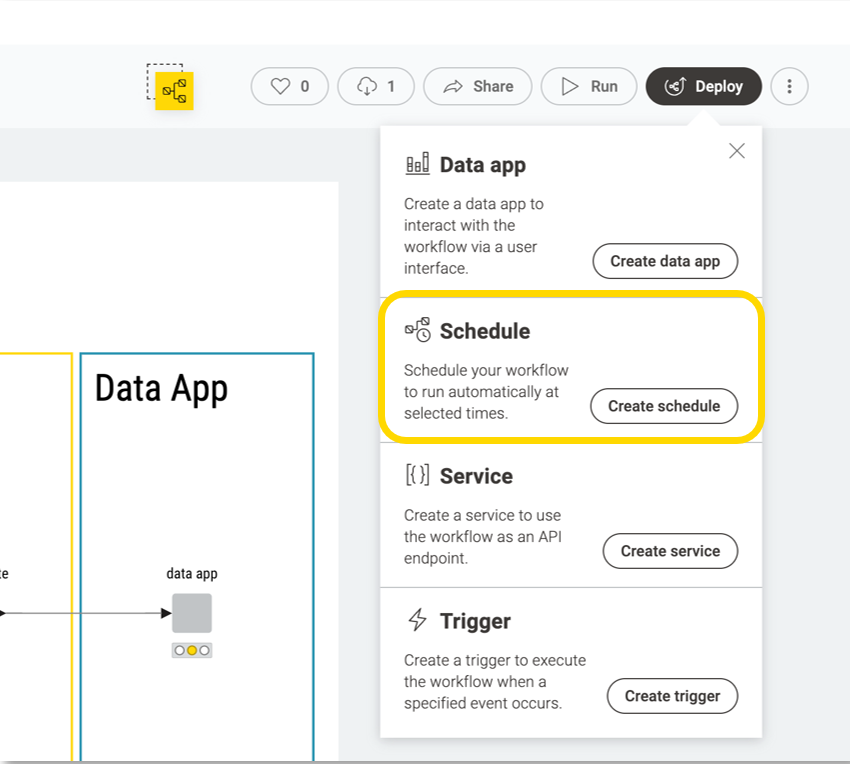
Notice that KNIME Business Hub and KNIME Community Hub exhibit similar functionalities and a similar UI, though acting on a different workload scale.
5. Set up triggered execution of the application
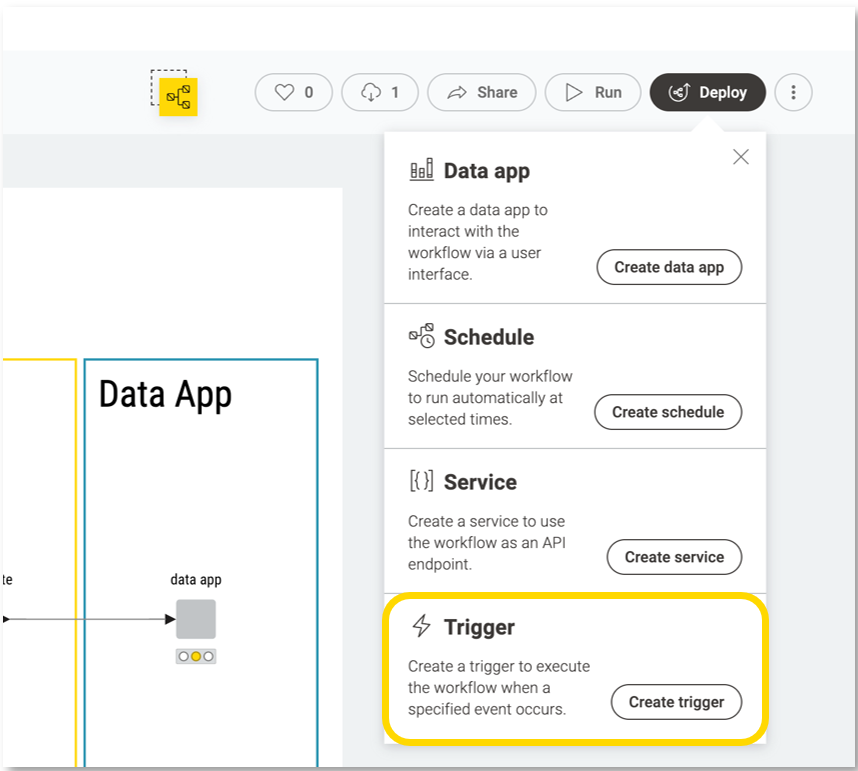
After uploading and testing the production application on the KNIME Hub, you can also set it up to run conditionally upon some expected trigger.
In this example, the execution of the AI interpreter gets triggered every time a new PDF report is produced (i.e. once a month). To configure the trigger, click “Deploy”, select the item “Trigger” and select the directory that will be monitored to detect newly added files.
6. Run analysis on-demand and share as a browser-based application across the organization
Finally, we wanted the last application, the one for visualization, to be deployed as a “Data App” to run on demand as a web application from any web browser. To do this, just deploy the workflow as a web application and then call it from your preferred browser.
7. Ensure guardrails for AI within the KNIME workflow
One more note before concluding covers the usage and guardrailing of AI within workflows. In the workflow prompting AI for the interpretation of the report, in order to avoid sensitive data to leave our platform and move to the AI on the cloud, we could use a form of routing control, that is:
- Use a local GenAI model
- Allow the usage of only some GenAI models
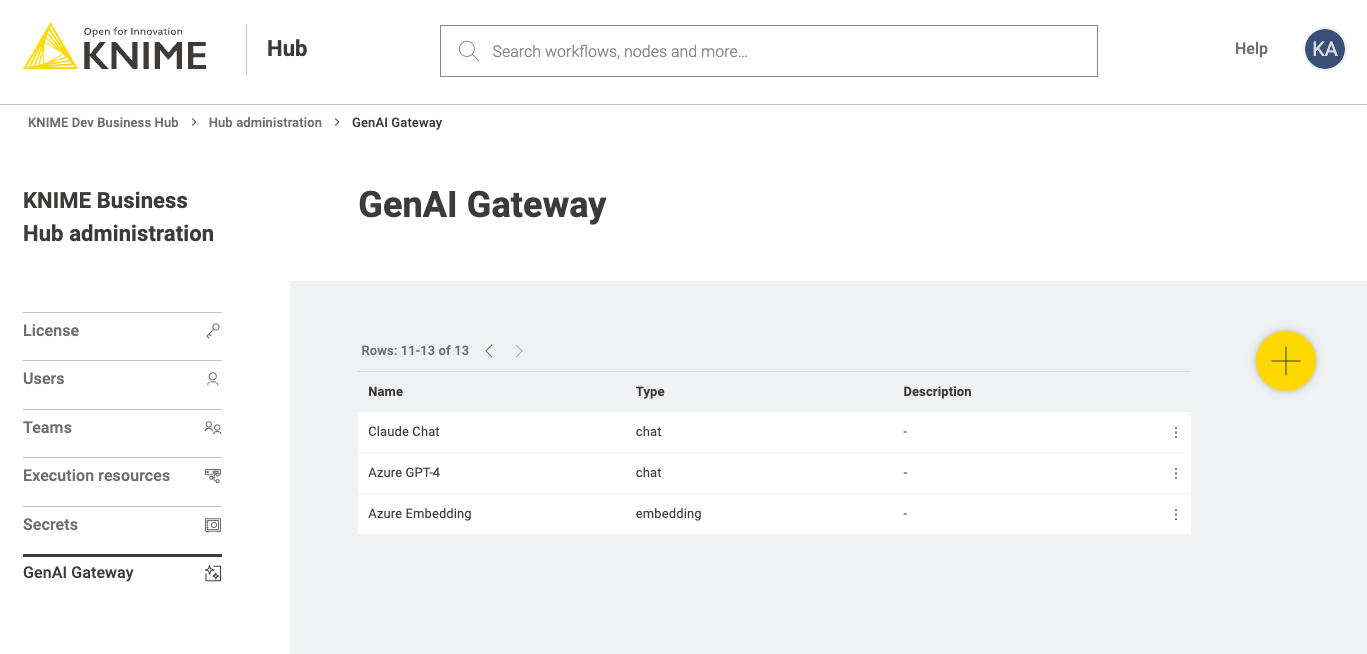
In the first case, we need to download the GenAI model of interest and then connect to it locally. In the second case, the KNIME Hub administrator can set up a list of allowed GenAI models from one or more GenAI providers. Those will be the only models visible to the workflow builder during implementation. A limited selection of GenAI providers can be enforced via the GenAI Gateway functionality of the KNIME Hub.
Run and automate workflows on KNIME Hub
In this article, we wanted to show the importance of a modular architecture for mainly efficiency reasons. Splitting up your workflow in logical blocks, allows for a few customizations during production, like the execution type or the AI protection, at the same time reducing the execution time and costs.

We have also shown how KNIME Hub can act as the director for the workflow orchestration and as the guardrail for the safety and security of the GenAI operations.
Get a free trial to run and automate workflows on a KNIME Community Hub Team Plan.
