Companies rely on Key Performance Indicators (KPIs) to track progress and guide decision-making. However, generating reports is just the first step: Interpreting those reports to extract actional insights is often time-consuming and requires expertise.
Generative AI (GenAI) tools can help automate this process, saving valuable time. In this blog post, we use KNIME Analytics Platform and the KNIME AI extension to build a workflow that leverages local large language models (LLMs) sourced from Ollama to analyze a company’s annual KPI report.
By running models locally, the workflow ensures data security, while automating the interpretation of the company’s six key KPIs, from employee turnover to CO2 emissions. We use llama3.2:1b to process text and llama3.2-vision to interpret charts, providing recommendations to support data-driven strategies.
Why monitor KPIs?
KPIs help companies measure performance, identify trends, and make informed decisions.
At the fictional software company, Deep Thought, the data team compiles an annual report for the CEO, summarizing key business metrics.
The six KPIs in the report include:
1. Revenue Growth: Percentage increase in revenues over time.
2. Gross Profit Margin: Percentage of revenue retained after costs of goods sold.
3. Market Share:Company's percentage of the total market within its industry.
4. Employee Turnover: Rate of change in the workforce.
5. Customer Churn: Percentage of customers leaving the company's business.
6. Carbon Emission: Total CO2 emissions from a company's operations.
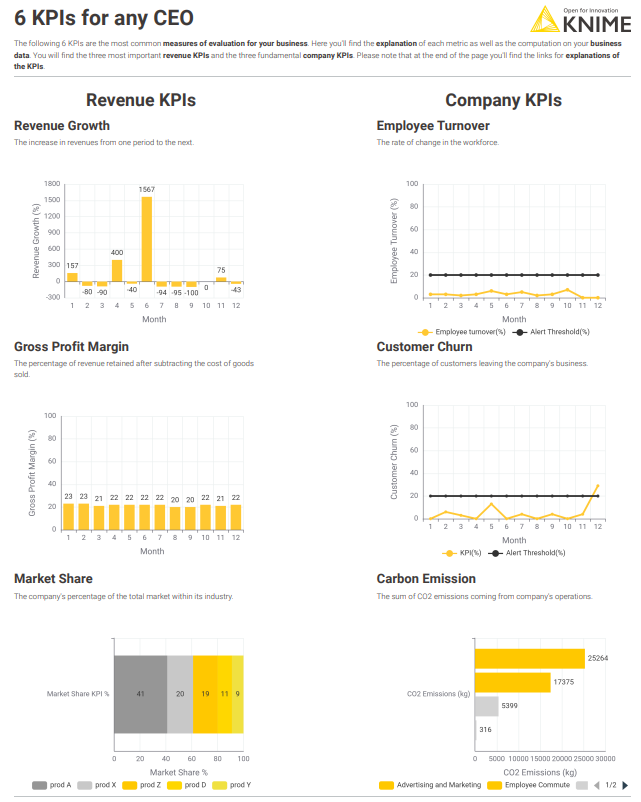
While the KPI report is neat and well-structured, interpreting KPIs can be complex and time-intensive, requiring expertise to uncover insights, spot critical trends, and craft actionable recommendations.
Instead of manually analyzing trends, you can automate the process with GenAI in a KNIME workflow. While LLMs might present some risks, they also offer a quick baseline to simplify KPI interpretation and generate strategic advice for addressing weaknesses highlighted in the charts.
How to build the KPI Interpretation workflow in KNIME
Download the workflow from KNIME Community Hub to follow along.
Step 1: Extract text from the KPI report
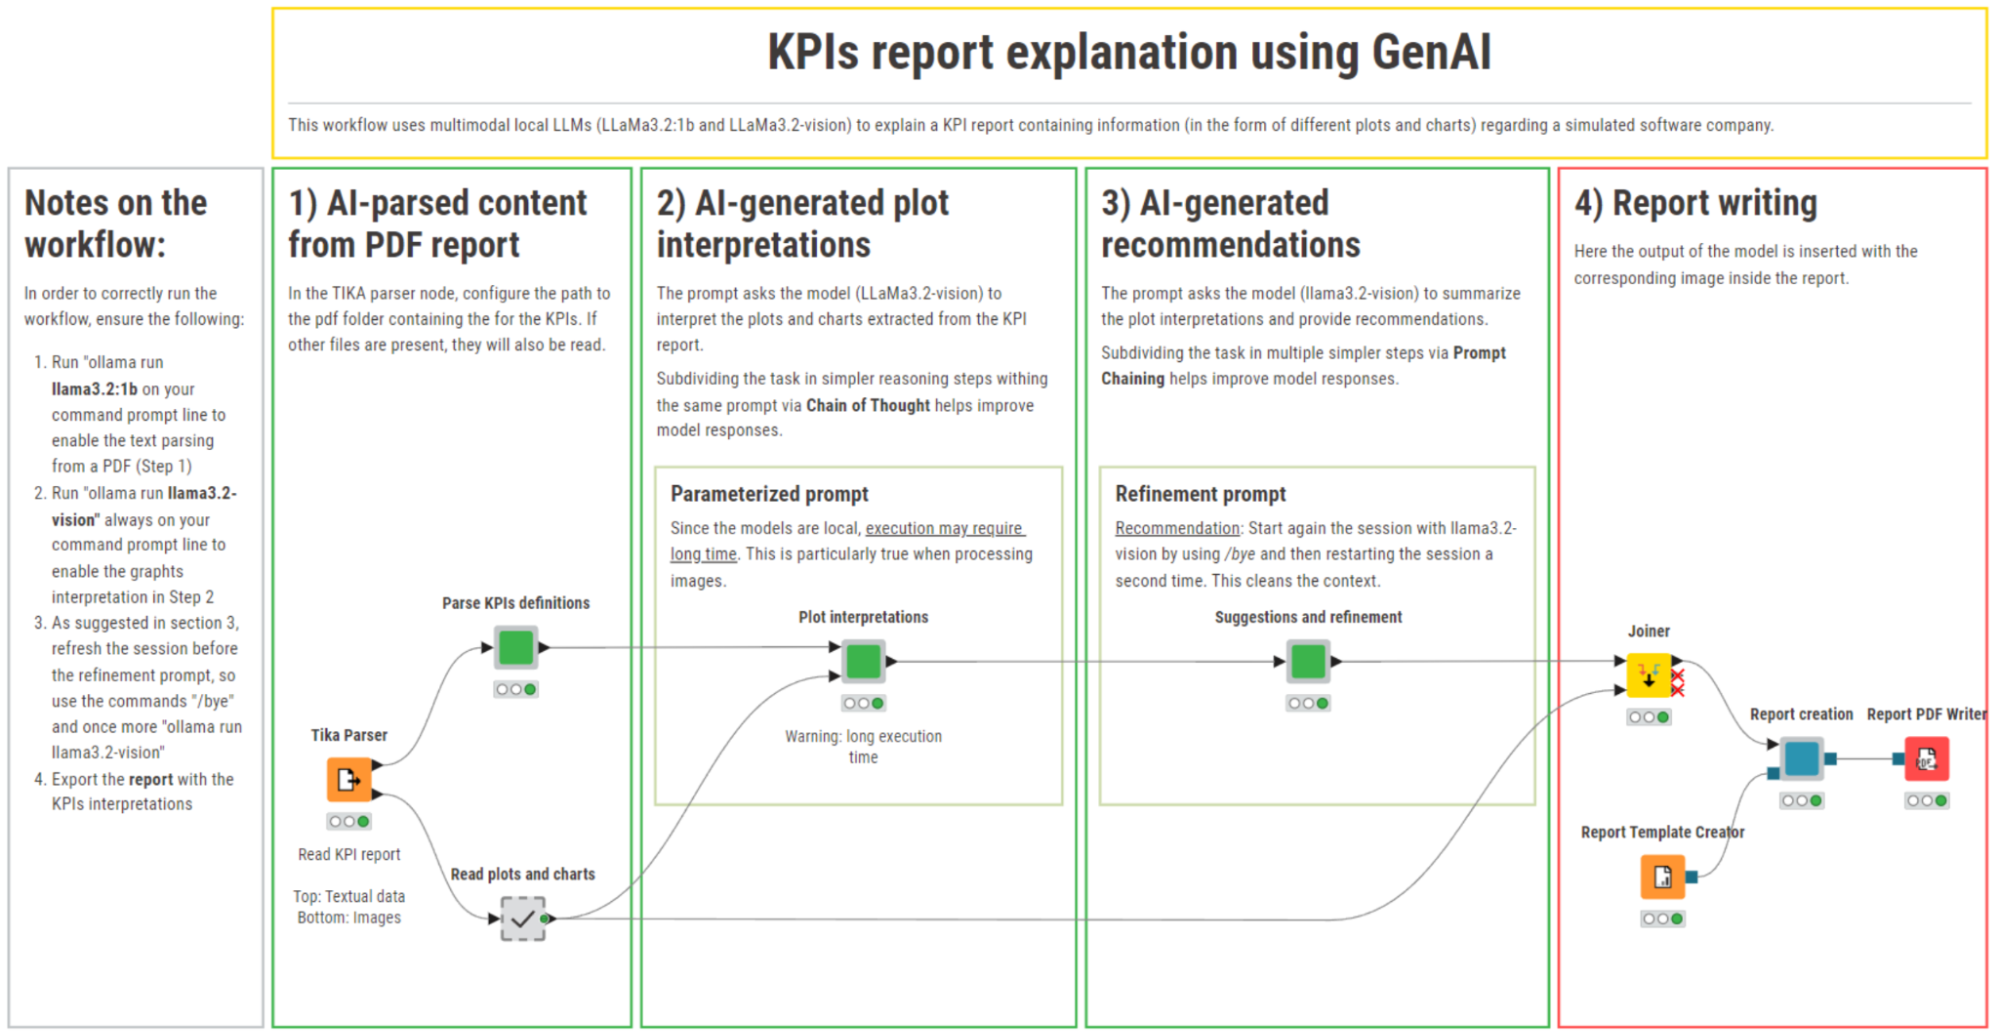
We start by parsing the KPI report (a PDF document) to extract KPI definitions, using the Tika Parser node. This node reads many different file formats and extracts the text and metadata, as well as in-line images (e.g. KPI charts) from documents and stores them to a local folder for later processing.
Challenge: The report follows a two-column layout, which causes text parsing issues. Since the Tika Parser node processes text top-to-bottom and left-to-right, the KPI definitions become misaligned.
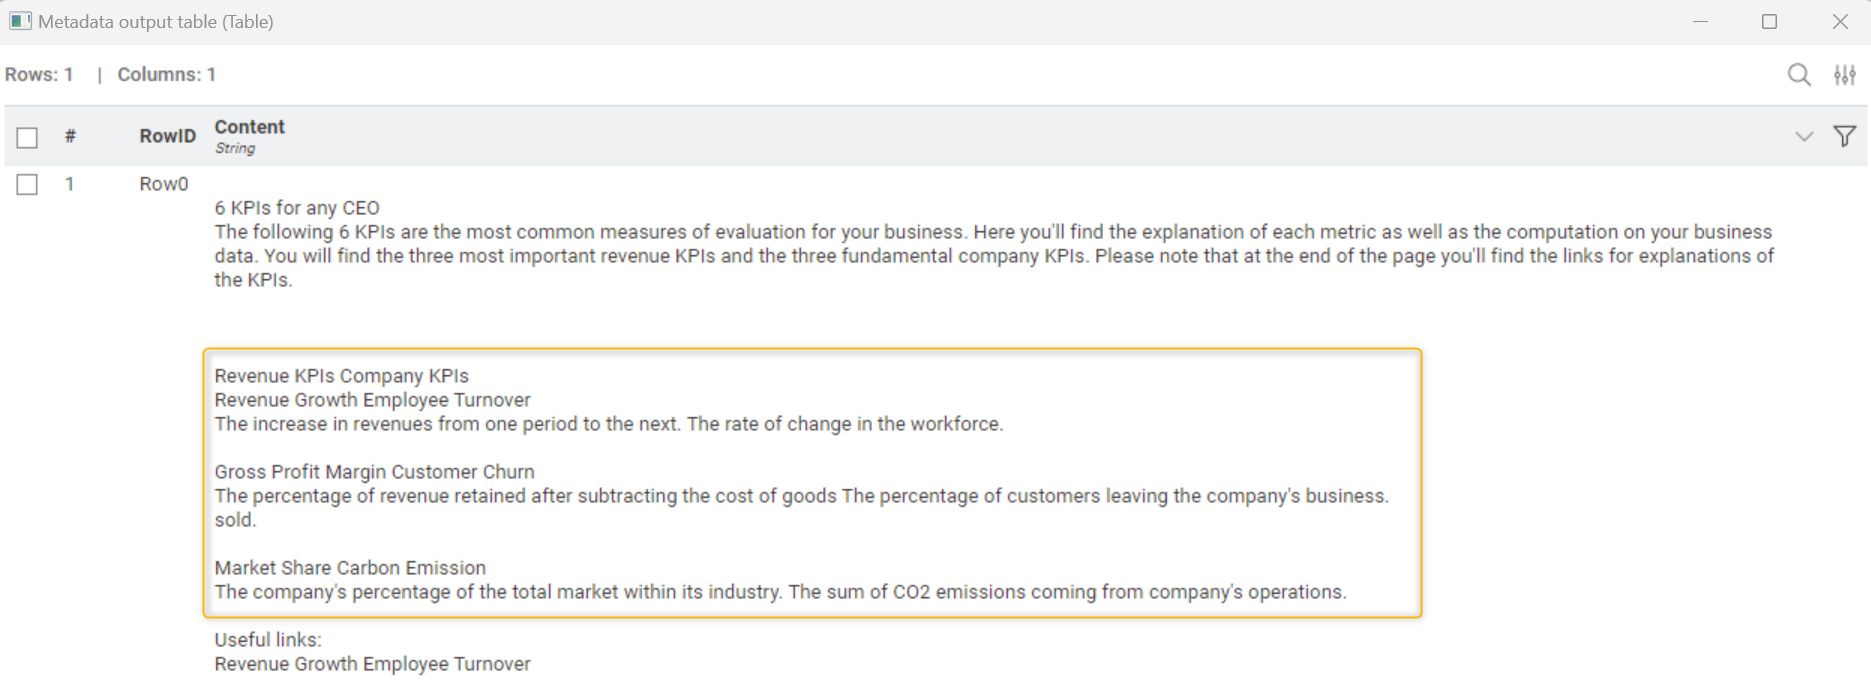
Solution: We use the local open-source LLM, llama3.2:1b, to correctly structure the extracted text.
Steps to apply local LLMs via Ollama in KNIME:
- Authenticate: Use the OpenAI Authenticator with dummy credentials and the base URL of a local host to establish a connection to Ollama.
- Connect: Use the OpenAI Chat Model Connector node to select the LLM model you want and define hyperparameters. Go to “All models → Specific model ID” in the connector node.
- Prompt: Use the LLM Prompter node to instruct the model to reorganize the KPI definitions.
Example prompt:
We used the following prompt in the Expression node:
Prompt: "Consider the following OCR file. There are 6 KPIs contained inside, but the structure of the pdf had 2 columns and 3 rows. So it's not easy to extract them, but associate each KPI with its definition. Return only a bullet list (with * at the begin) with each KPI and the following description. OCR: " + ($["Content"] )
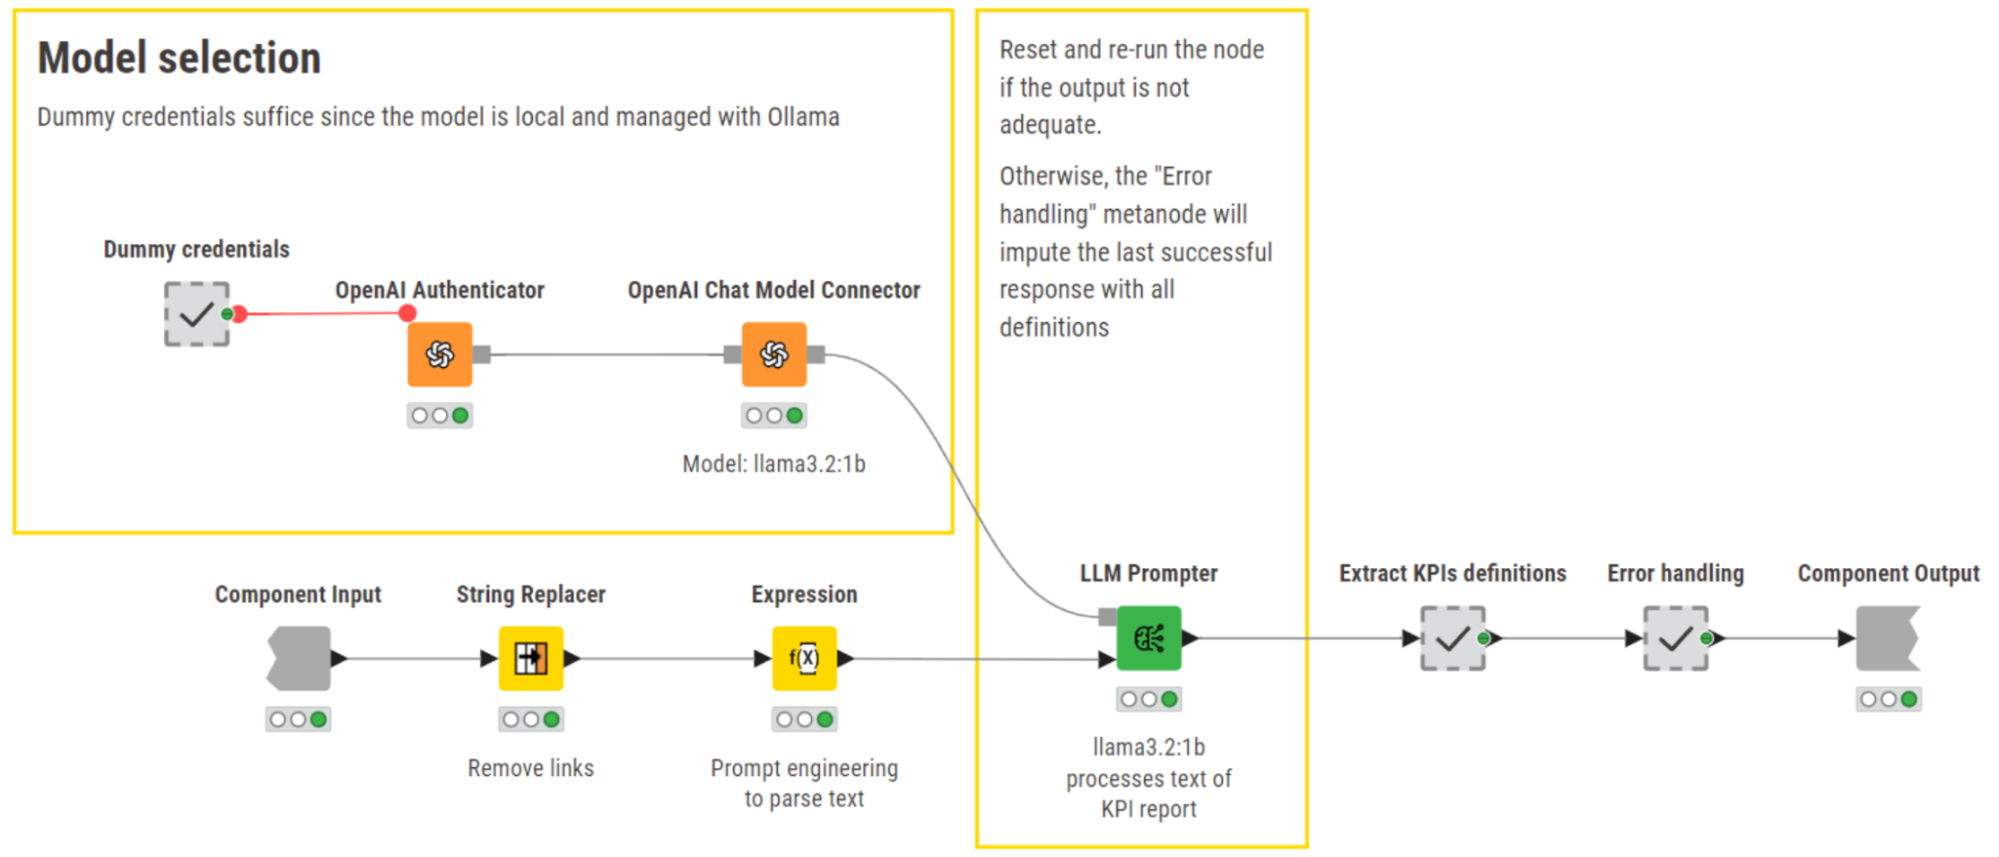
After processing, the KPI definitions are properly structured and ready for the next step: We want to use these KPI definitions to enrich the next prompt with context and obtain better plot interpretations.

Step 2: Access and encode KPI visualizations
Since KPI insights rely on both text and charts, we have to extract and prepare visual data for processing.
- Extract charts: The Tika Parser node extracts in-line images from documents and saves the KPI visualizations to a defined folder.
- Read images: The Image Reader (Table) node, which is inside the “Read plots and charts” metanode, imports them.
- Convert images to Base64 (i.e., ASCII format): This conversion is needed to include KPI plots in the next prompt and allow the LLM to correctly “see” them. First, we transform images into binary objects with the PNGs to Binary Objects node, and then finalize the encoding using the Binary Object to Base64 component.
Encoding ensures that both the KPI definitions and visualizations can be included in the next prompt, where we’ll ask the LLM for interpretations and recommendations.
Step 3: Interpret KPI visualizations and recommend actions with multimodal local LLMs
To interpret KPI visualizations and generate recommendations for improving the company’s performance, we use llama3.2-vision, an open-source, multimodal, 11b-parameter model sourced for free from Ollama.
Note: The term “multimodal” indicates that these models are capable of understanding and generating information across multiple formats, such as text, images, and audio.
The model performs two tasks:
- Image-to-text: Interprets the KPI plots
- Text-to-text: Generates improvement recommendations.
This task is fairly complex and, while the model has good capabilities, we can be smart about the way we prompt it to meet our expectations and optimize its performance.
Optimize the prompt for better results
We can improve the LLM performance with two prompting techniques:
1. Chain-of-Thought Prompting (CoT) guides the model through a structured reasoning process. The user instructs the LLM in a single prompt to break down a complex task and reason through the task step by step before generating a response. In our example we want the LLM to interpret plots.Example prompt: “Comment the trend of this KPI using the following instructions. The KPI is: [KPI definitions]. Provide an interpretation for the CEO of the Deep Thought software company. Note that, if there is a time variable it likely is a month. Some other graphs may not have temporal information, so pay attention. Let's start with generally describing the graph, by identifying the x variable and then the y variable. And to generally observe the behavior of the chart/plot. Later this will be used for suggestions and refinement.”
In the prompt, you can see how we guided the model to approach the task step-by-step, interpreting KPI visualizations by structuring its reasoning on how to analyze plots and charts. This included actions like first identifying the x- and y-axis dimensions or observing trends in plots with a time variable:
2. Prompt Chaining breaks tasks down into a series of separate prompts (a.k.a. chain). Here, we are using it for suggestions and refinement.
Example prompt: “Followingly, you find the response of LLaMa3.2-vision to interpret a KPI graph for the CEO of the DEEP THOUGHT software company. We need to summarize it and to provide suggestions to improve in terms of this KPI for the future. Please let the final response be of maximum 5 lines in total. Directly write the output without introducing it or commenting on it. RESPONSE: [KPI plot interpretations]”
We broke down the task into two different prompts. The first prompt asks the model for an interpretation of the KPI plots. The second prompt is enriched with the output of the first prompt and asks the model to formulate concise recommendations for the CEO.
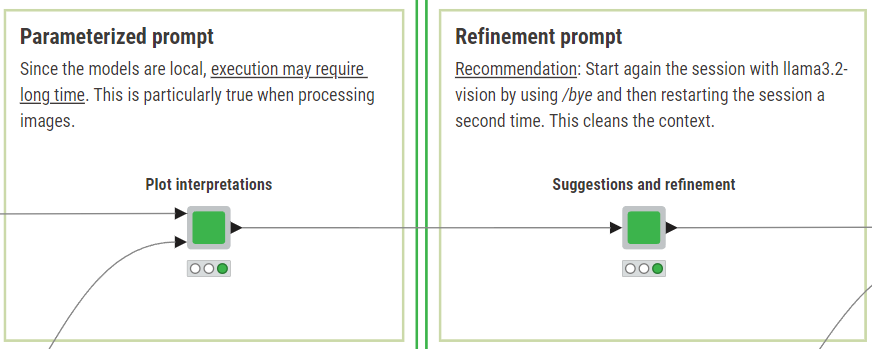
Image-to-text: Plot interpretation
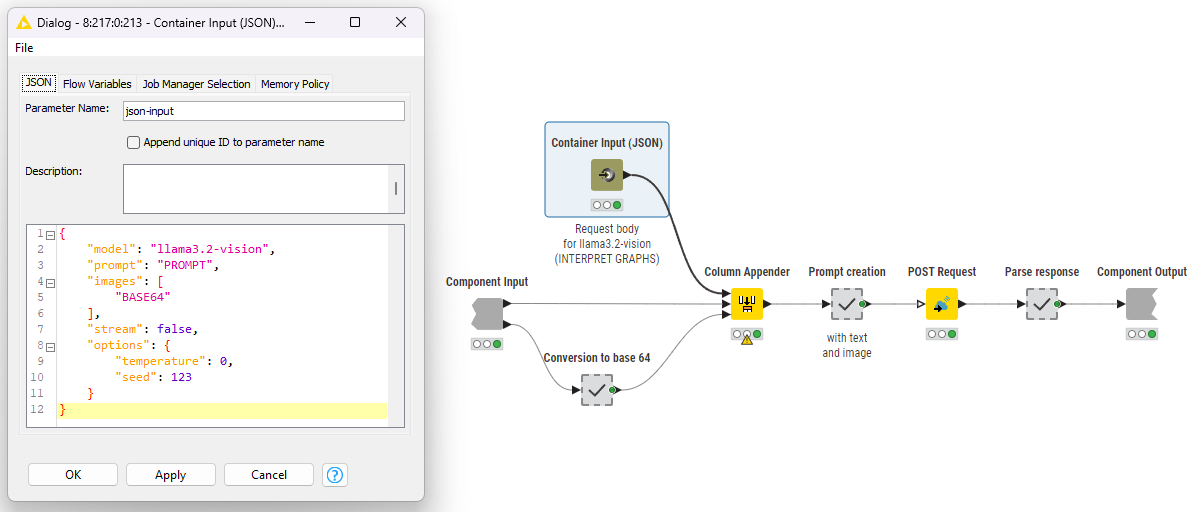
In KNIME we use llama3.2-vision to interpret the KPI visualizations. We use the POST Request node, providing the pertinent local URL: http://localhost:11434/api/generate as defined by the Ollama API, and set a very high timeout (i.e., 600 s).
The crucial part, though, is what the JSON request body that is fed to the POST Request node contains.
To define this request body, we use the Container Input (JSON) node. We set the model name, temperature and seed statically and parameterize the name-value pairs for the “prompt” and “images”.
This JSON request body structure is consistent across all six KPIs: The "prompt" and "images" values are each dynamically updated to reflect the task (including the KPI definition parsed in step 1) and the corresponding base64-encoded visualization.
Note. The image-to-text task is computationally expensive. On a Lenovo ThinkPad T14s with AMD Ryzen 7 PRO 4750U, execution takes approximately 20 minutes (for all 6 requests).
Text-to-text: Suggestions and refinement
The KPI interpretations obtained in the first prompt are now used as context in a second prompt. The goal of the second prompt is to refine the interpretations and provide suggestions to the CEO for improving the KPIs.
As the second prompt is purely textual, it’s possible to use the OpenAI’s nodes for authenticating and connecting, and the LLM Prompter node for prompting, similarly to how we extracted the KPI definitions.
With this last prompt, we have now completed the interaction with the model and obtained interpretations of the KPI visualizations and suggestions for improvement.
Results: Interpreted KPI Trends and Recommendations
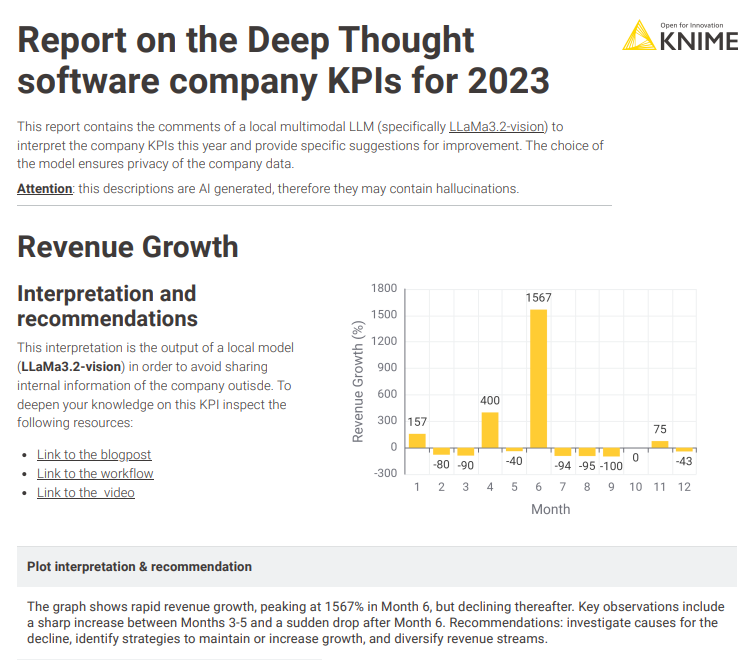
The responses of the LLM can be compiled into a static report using the KNIME Reporting extension and shared across the company.
Example: Revenue Growth KPI
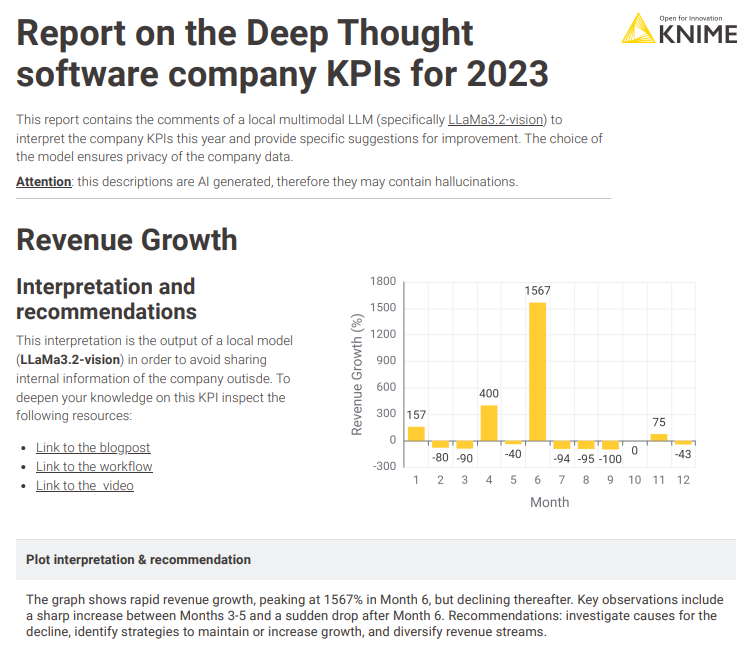
Trend detected:
- Two spikes are identified: A smaller spike in April, and a decline in the second part of the year.
Recommended actions:
- Investigate factors driving spikes.
- Diversify revenue streams to address the decline and stabilize growth.
Example: Customer Churn KPI
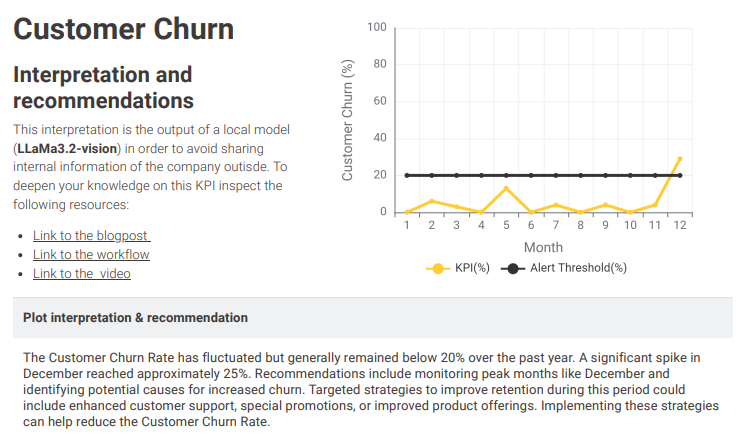
Trend detected:
- Churn rate remains below 20% except in December (spike to approx. 25%).
Recommend actions:
- Introduce targeted promotions.
- Improve customer care support strategies.
The interpretation of the remaining KPIs yielded equally satisfactory results, helping us automate the compilation of crucial insights and derived recommendations.
Enhance KPI analysis with GenAI
This workflow demonstrates how local LLMs can improve KPI reporting by:
- Extracting structured text from complex reports
- Interpreting KPI charts with multimodal models
- Generate actionable recommendations for decision-making
- Ensure data security by running AI models locally
Considerations and next steps
- Task complexity: Some charts may include hard-to-read digits, low-contrast colors, and require substantial inference by the LLM.
- Model limitations: Local models like llama3.2-vision are less powerful than cloud-based alternatives (e.g., GPT-4o, which has ~20x more parameters and a more advanced architecture).
- Future improvements: More capable local models like llama3.2-vision:90b or state-of-the-art alternatives can be explored for continuous performance improvements.
