Graph databases have garnered significant attention due to their potential for real-world applications. That’s because graph databases store data as a flexible network of entities and relationships – in contrast to traditional databases, which store information in rigid tables. As a result, graph databases provide greater flexibility and are faster at retrieving information and finding connections.
Among the leading options in this field is Memgraph. Memgraph is a modern, high-performance graph database designed for real-time processing. It’s also fully compatible with Neo4j. While Neo4j is a high-performance graph database with a broader ecosystem. Memgraph is generally faster for streaming data. In terms of cost, Memgraph is open-source and more budget-friendly, whereas Neo4j’s licensing and enterprise features can be expensive.
At Redfield, we recognize the growing importance of graph databases like Memgraph. That's why we developed the Memgraph Extension for KNIME Analytics Platform. This extension allows users to easily access Memgraph databases and analyze graph data directly within KNIME’s low-code environment.
In this article, we’ll
- Introduce Memgraph
- Explore the capabilities of the new Memgraph Extension for KNIME
- Explain our shareable components for data preprocessing
- Demonstrate how you can use the extension to create and analyze a graph database in KNIME
Our topic? Cocktails! We hope you enjoy the read.
What is Memgraph?
Memgraph is a high-performance graph database that processes and stores data entirely in-memory, enabling extremely fast queries and traversals for connected data. Memgraph is designed for real-time graph analytics and processing. Data is stored in Memgraph databases as nodes (entities) and relationships (connections between entities).
Unlike traditional relational databases, which struggle with complex relationships, graph databases like Memgraph excel at handling interconnected data, making them particularly effective for applications such as:
- Network security analysis (e.g. detecting anomalies in system behavior)
- Recommendation engines (e.g. personalized content or product suggestions)
- Complex relationship analysis in large, dynamic datasets (e.g. community detection)
Introducing the Memgraph Extension for KNIME
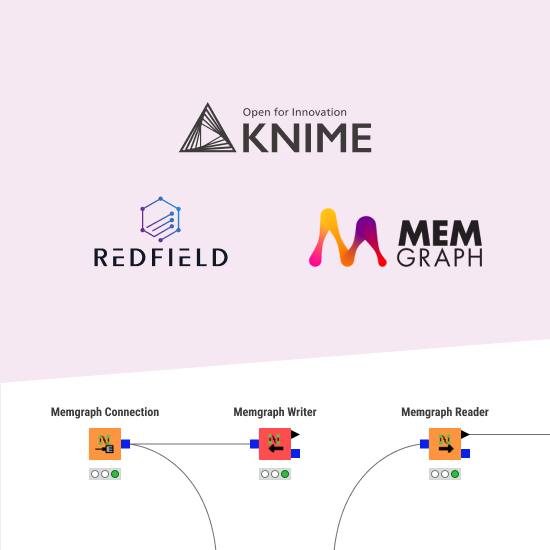
The Memgraph Extension for KNIME Analytics Platform enables users to integrate Memgraph databases into their workflows without any need for extensive coding experience. The extension includes three essential nodes.
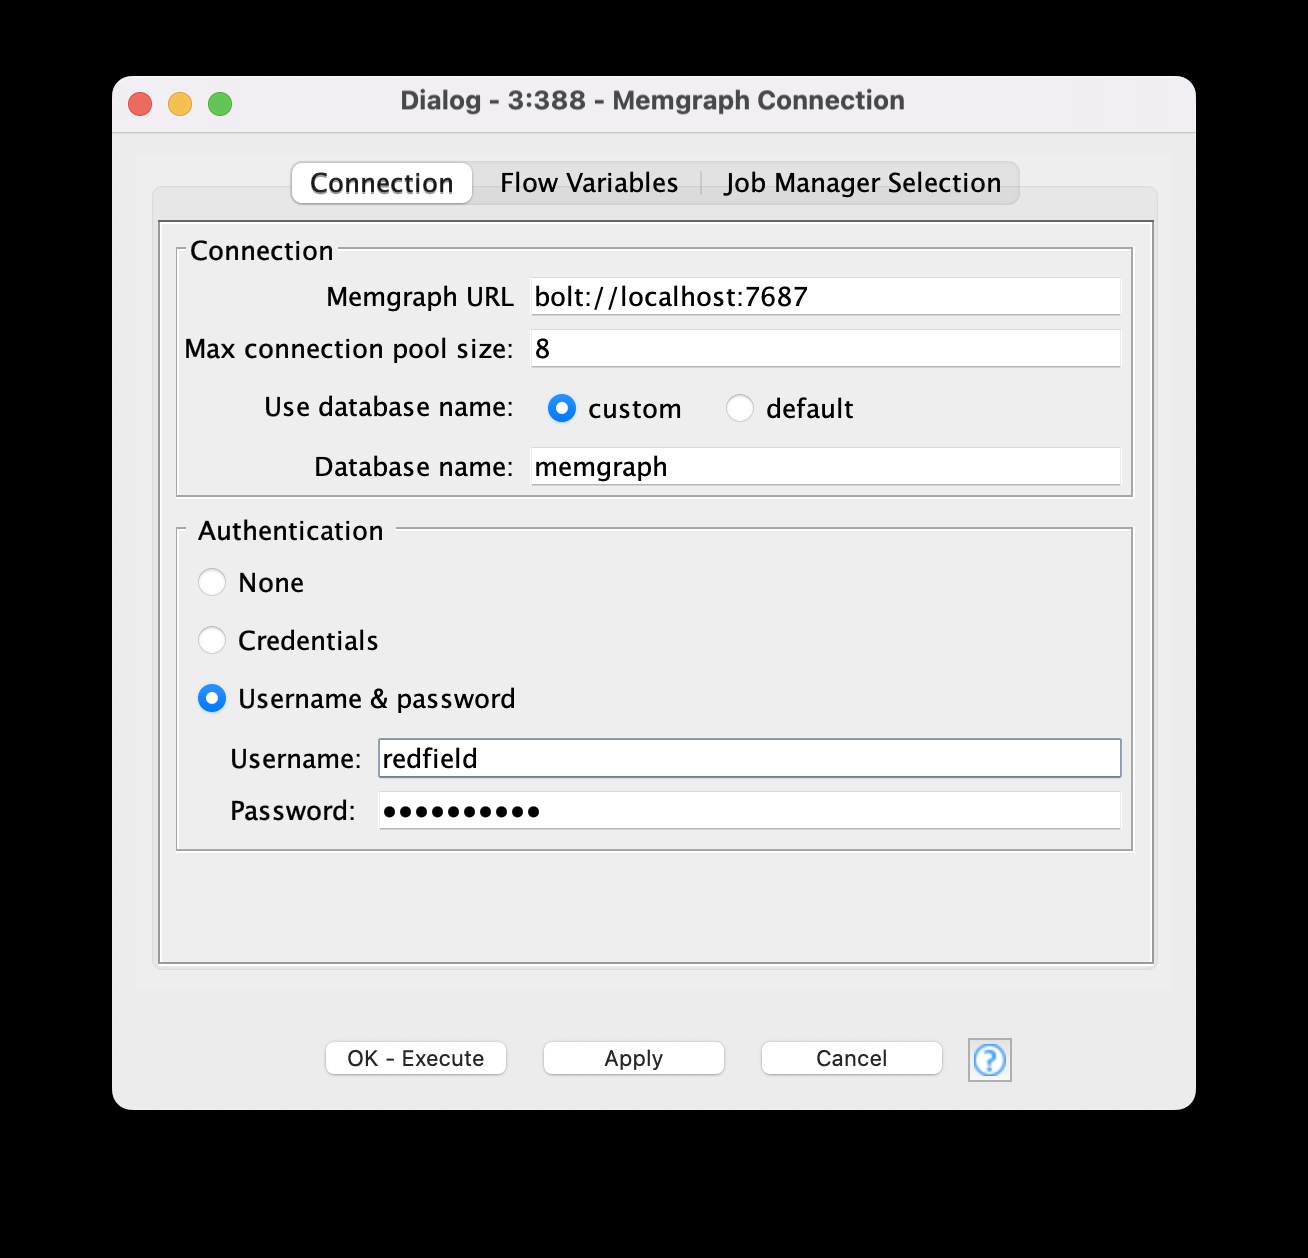
1: Memgraph Connection Node
This node establishes a connection to the Memgraph database using the native BOLT protocol.
- It requires simple configuration settings: URL, username, and password. You can also use your KNIME credentials if you created them in the workflow.
- It supports connection pooling: You can set the number of connections to the database. By default, it is set equal to the number of available CPU threads.
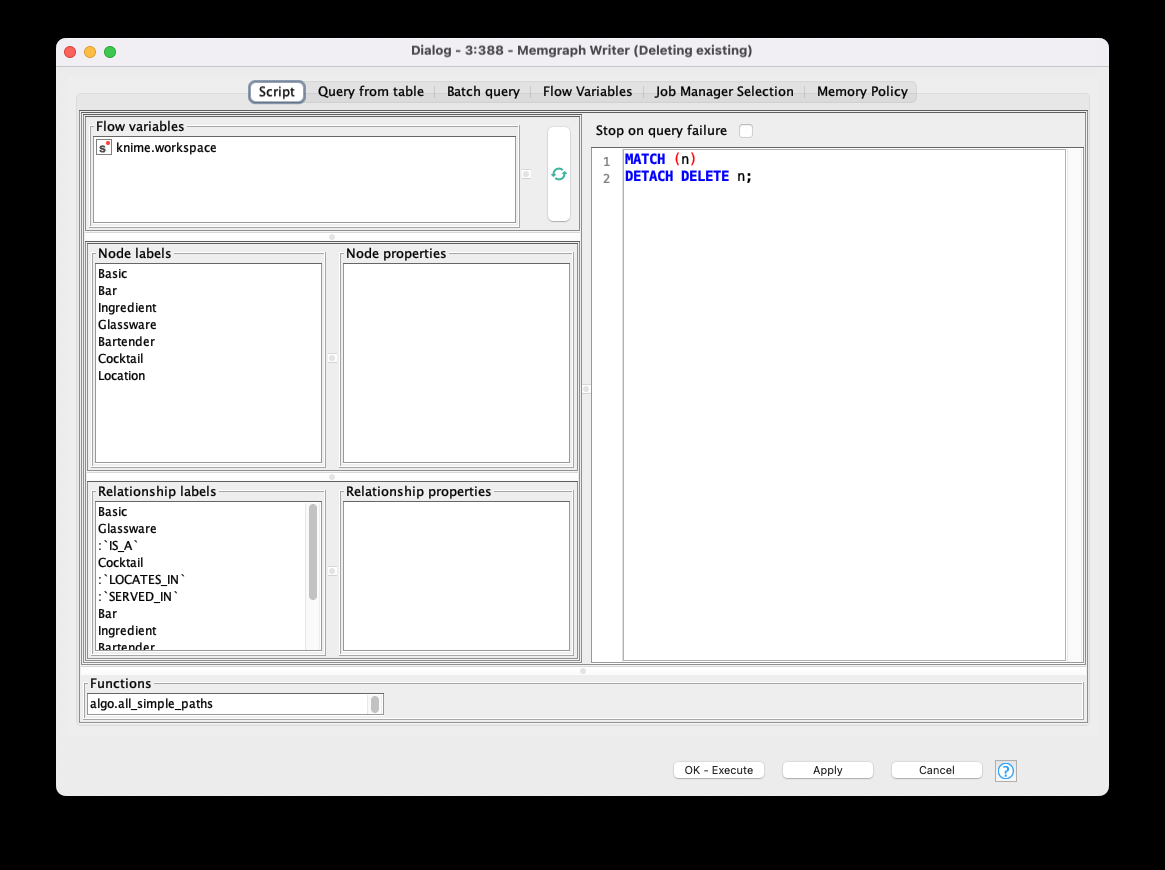
2: Memgraph Writer Node
This node inserts data into the Memgraph database using two modes:
- Script Mode. Manually defines a Cypher query. This query can be enriched with injections of node and relationship labels, their properties, Memgraph functions and flow variables — just double-click on one of them to inject into the script body.
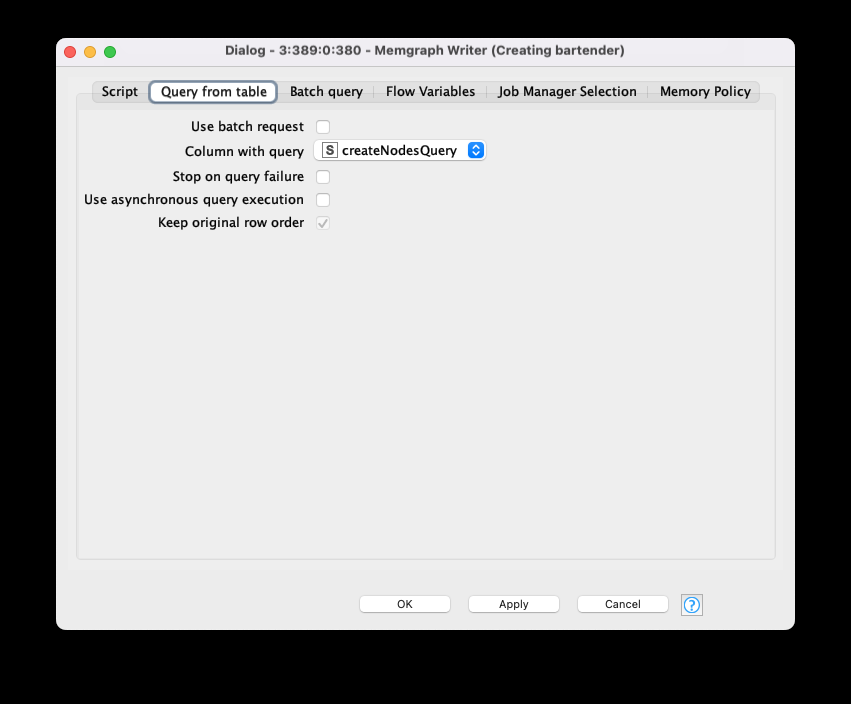
- Table Mode: Automates query execution from a table of Cyber queries. To use it, activate the dynamic port and feed the table with Cypher queries (String column node). Select a column with queries and define the query execution mode: asynchronous or sequential. The first mode runs the queries in parallel batches, which is faster. Note that if the order of execution is important, you can deactivate this checkbox.
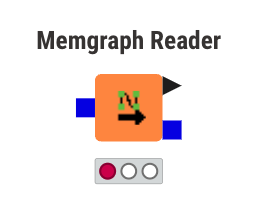
3: Memgraph Reader Node
This node extracts data from Memgraph for analysis.
- It is configured in a similar way to the Writer node and includes the same modes: script and table
- Matches the data types between Memgraph and KNIME and converts primitive types (e.g. String, Integer, Double, etc.), dates and collections
- Supports JSON output, e.g. if you want to extract complex data structures (check the “Use JSON output” checkbox)
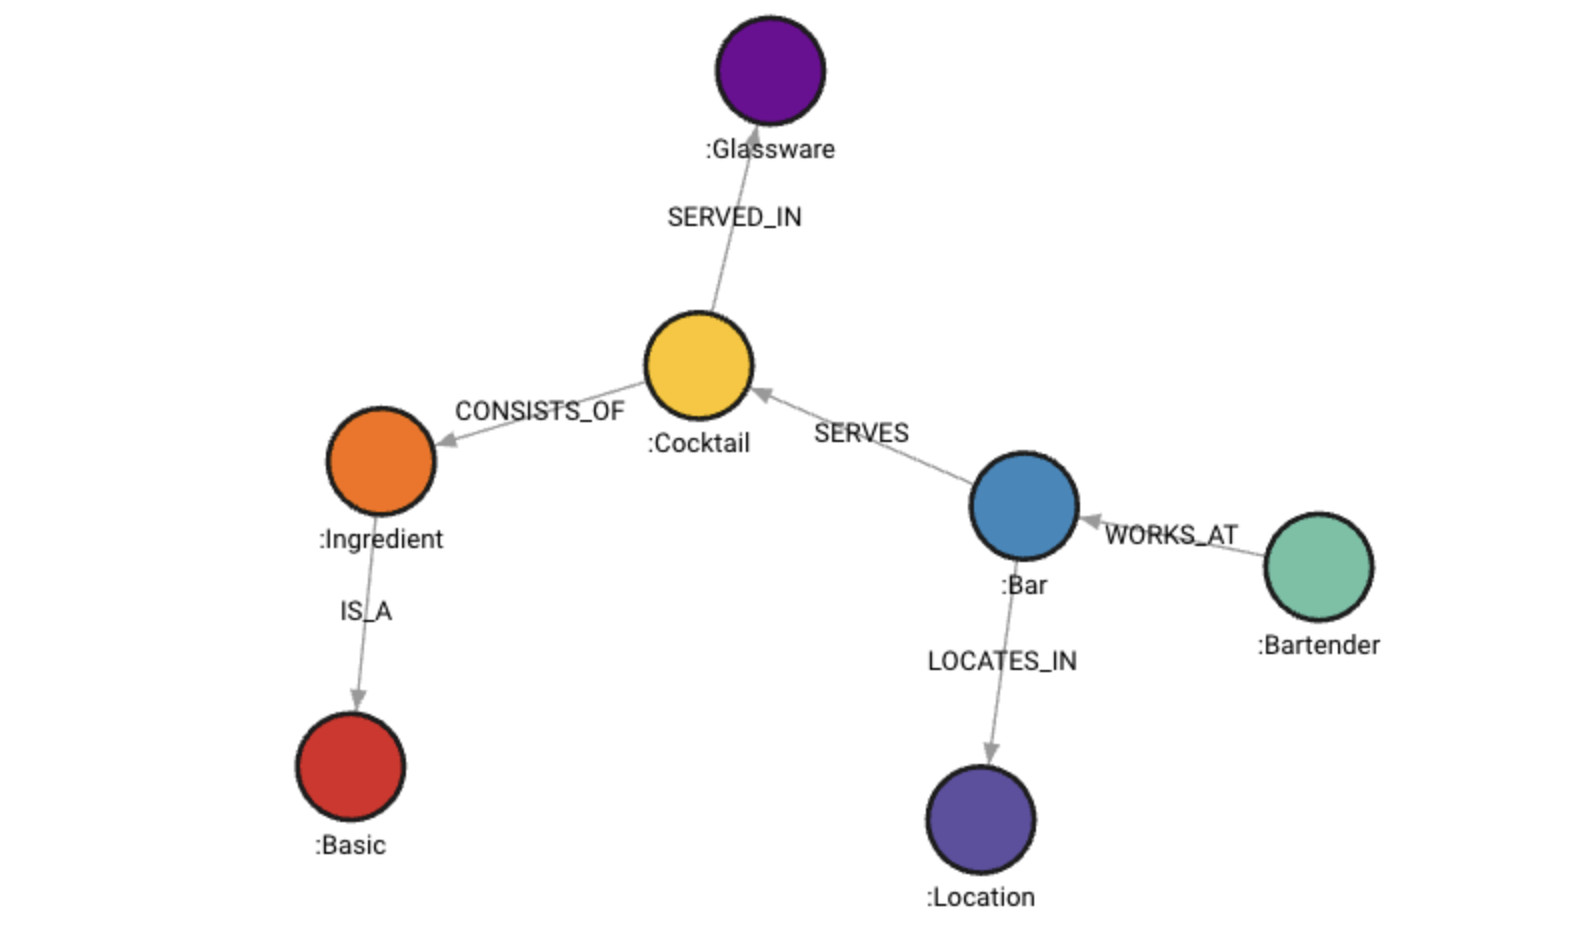
Building a cocktail graph database with Memgraph
To demonstrate how you can use Memgraph in KNIME we created an example based on a dataset of cocktails. The dataset, sourced from Kaggle includes information on:
- Cocktail ingredients
- Bars serving cocktails
- Bartenders who serve cocktails
- Glassware for different cocktails
Step 1: Prepare and import your data into Memgraph database
Datasets always require some preprocessing before we can use the data. We had to:
- Clean column names for consistency
- Remove missing values from the cocktail ingredients
- Prepare and create nodes (entities) and relationships.
ETL made easier with shareable components for Memgraph
Preprocessing is a tedious but necessary part of data analytics. We have developed a set of components to help you generate Cypher queries for creating nodes (entities) and relationships efficiently.
In the following sections, we will provide an overview of these components and how to use them.
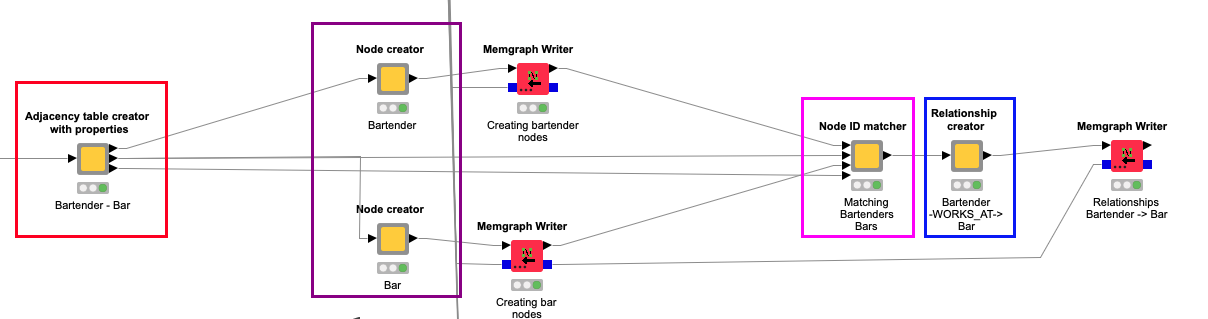
Component 1: Adjacency table creator with properties
This component generates three intermediate tables that serve as the foundation for constructing Cypher queries for nodes and relationships. These outputs include:
- Aggregated table for future source nodes: Contains source nodes along with lists of their consecutive target nodes.
- Aggregated table for future target nodes: Contains target nodes along with lists of their consecutive source nodes.
- Column names for source and target nodes: Helps creating relationships.
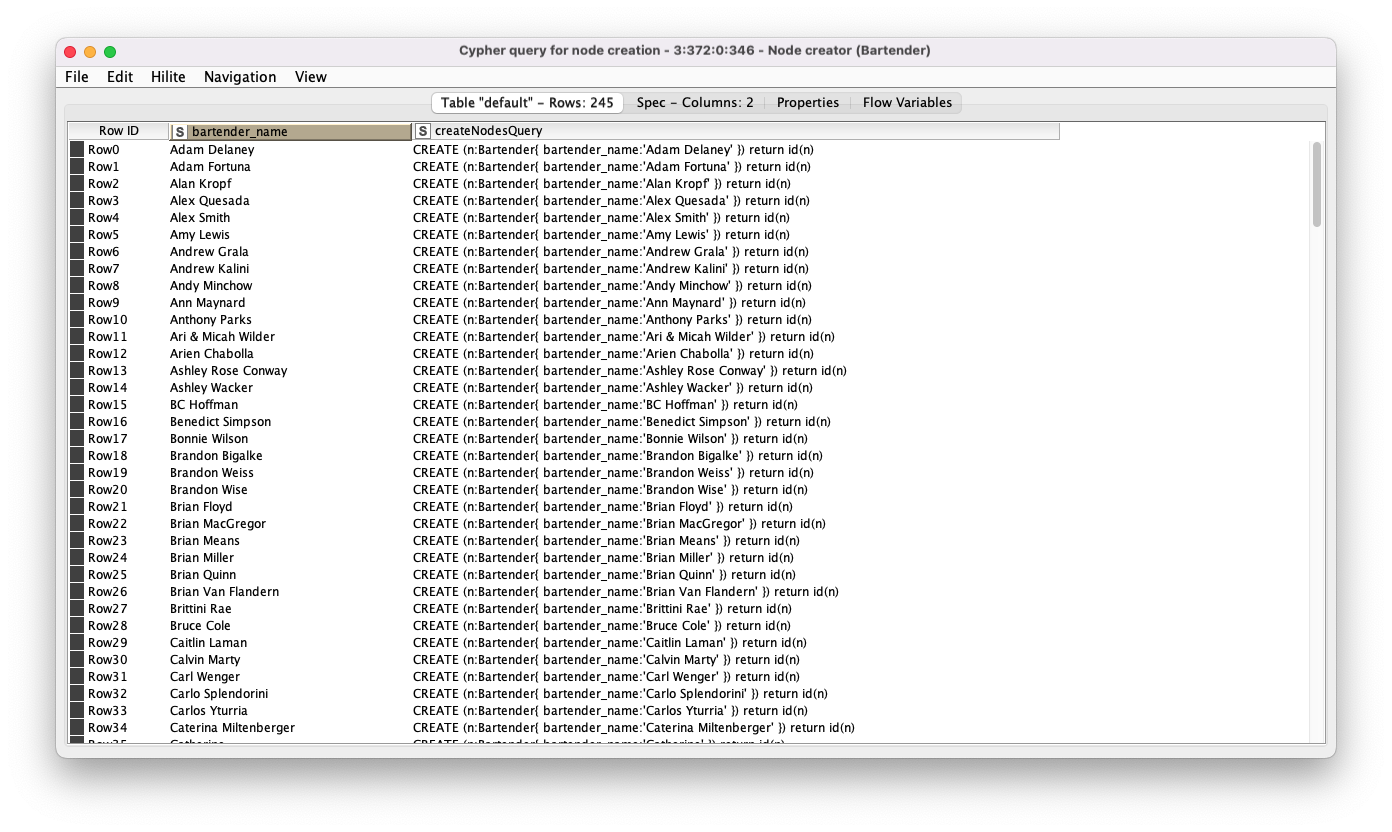
Component 2: Node creator
This component uses one of the first two outputs of Component 1 to generate the Cypher queries for creating nodes (entities) and their properties.
The output of the node is a table with the node selected properties and the Cypher queries built according to the settings. Then this table is fed to the Memgraph Writer node, which can run multiple queries asynchronously.
Component 3: Node ID Matcher
The Node ID Matcher Component simply joins the source nodes (source entities) with target nodes (target entities). These joins are necessary to create the relationships between the nodes. We only need to perform joins here; afterward all the relationships are stored in Memgraph.
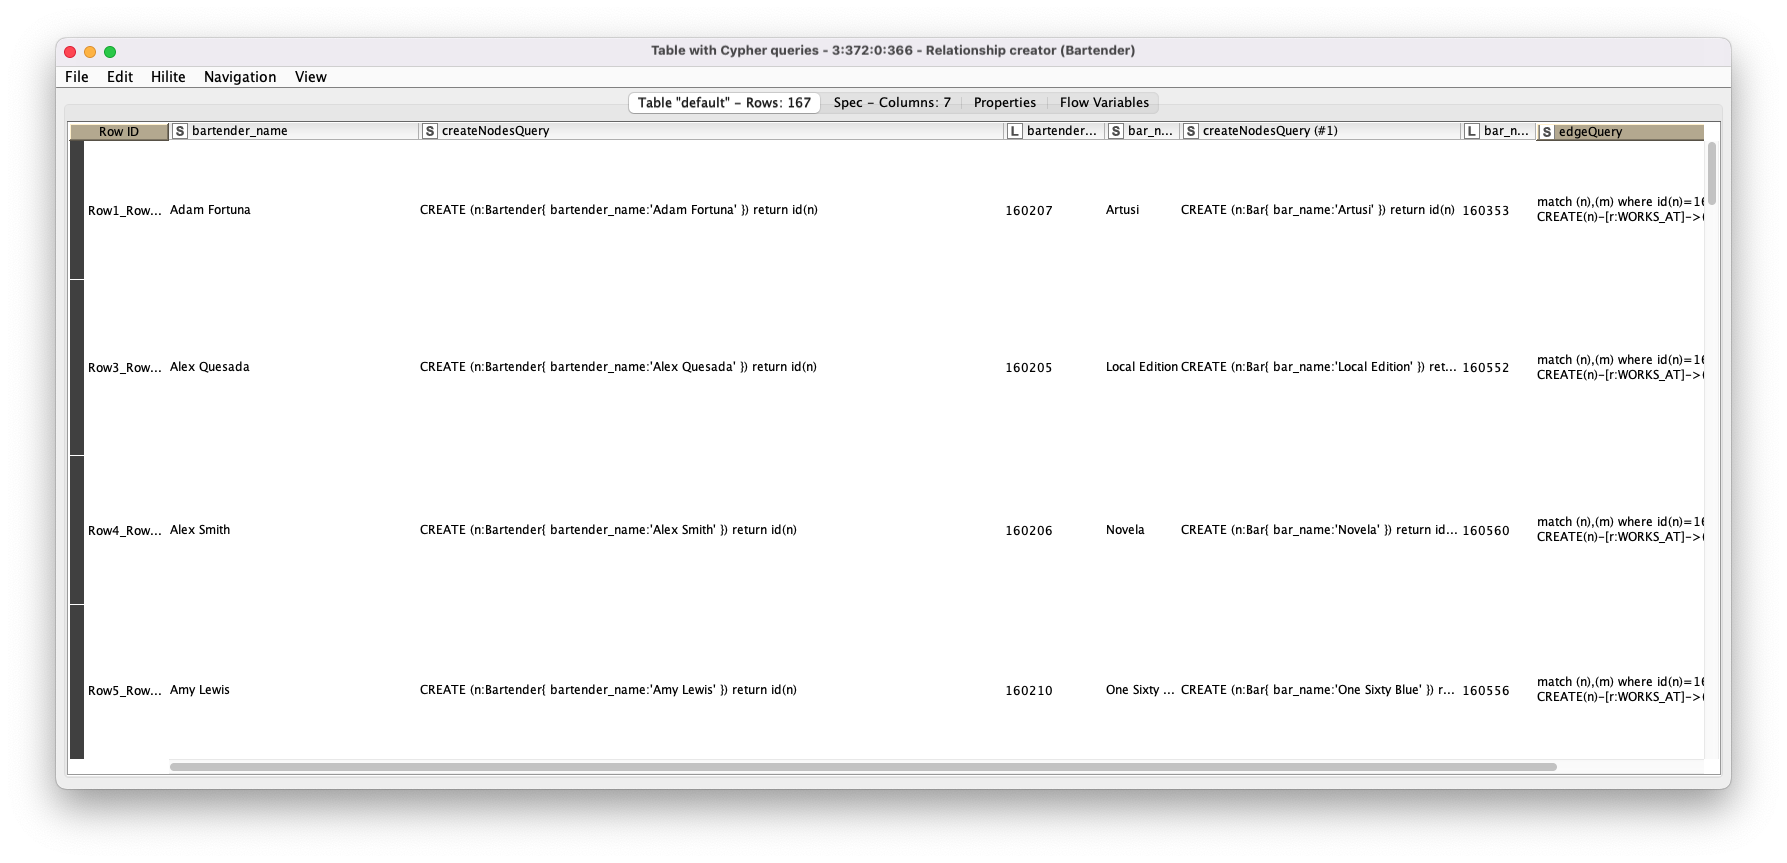
Component 4: Relationship Creator
Relationship Creator component uses the output of the Node ID Matcher component to generate the Cypher queries for creating relationships between nodes (entities). This queries are then fed to the Memgraph Writer node.
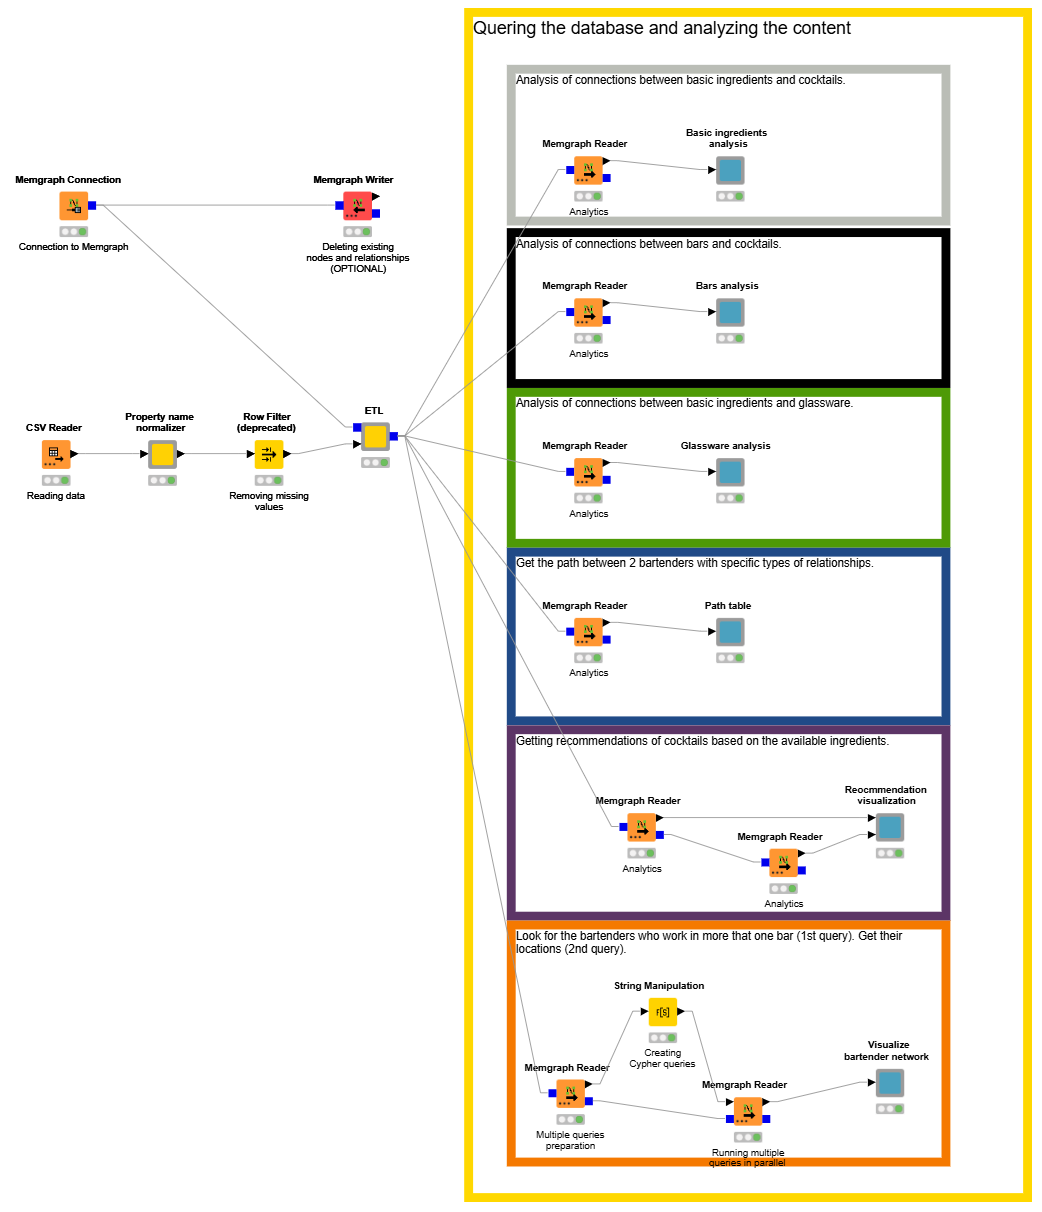
Step 2: Analyze the cocktail graph database
With our data now uploaded to the graph database set up in Memgraph, we can analyze it.
In our example workflow, we use KNIME to explore the Memgraph database and
- Analyze the relationships among the different entities
- Apply standard aggregation methods to visualize the results
Let’s take a look at each of the six use cases:
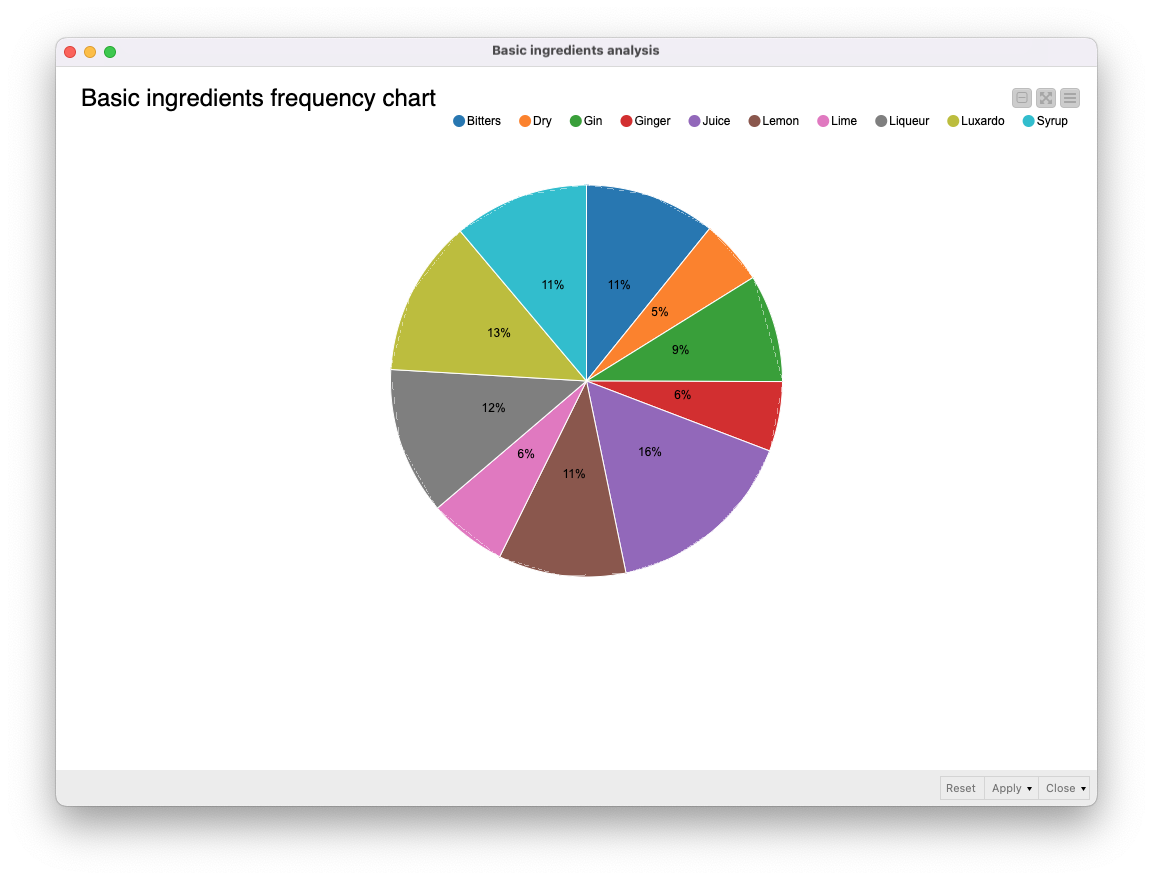
Use case 1: Identify the most common ingredients
By analyzing the relationships between cocktails and their ingredients, we identified the top 10 most frequently used ingredients, and visualized them in a pie chart.
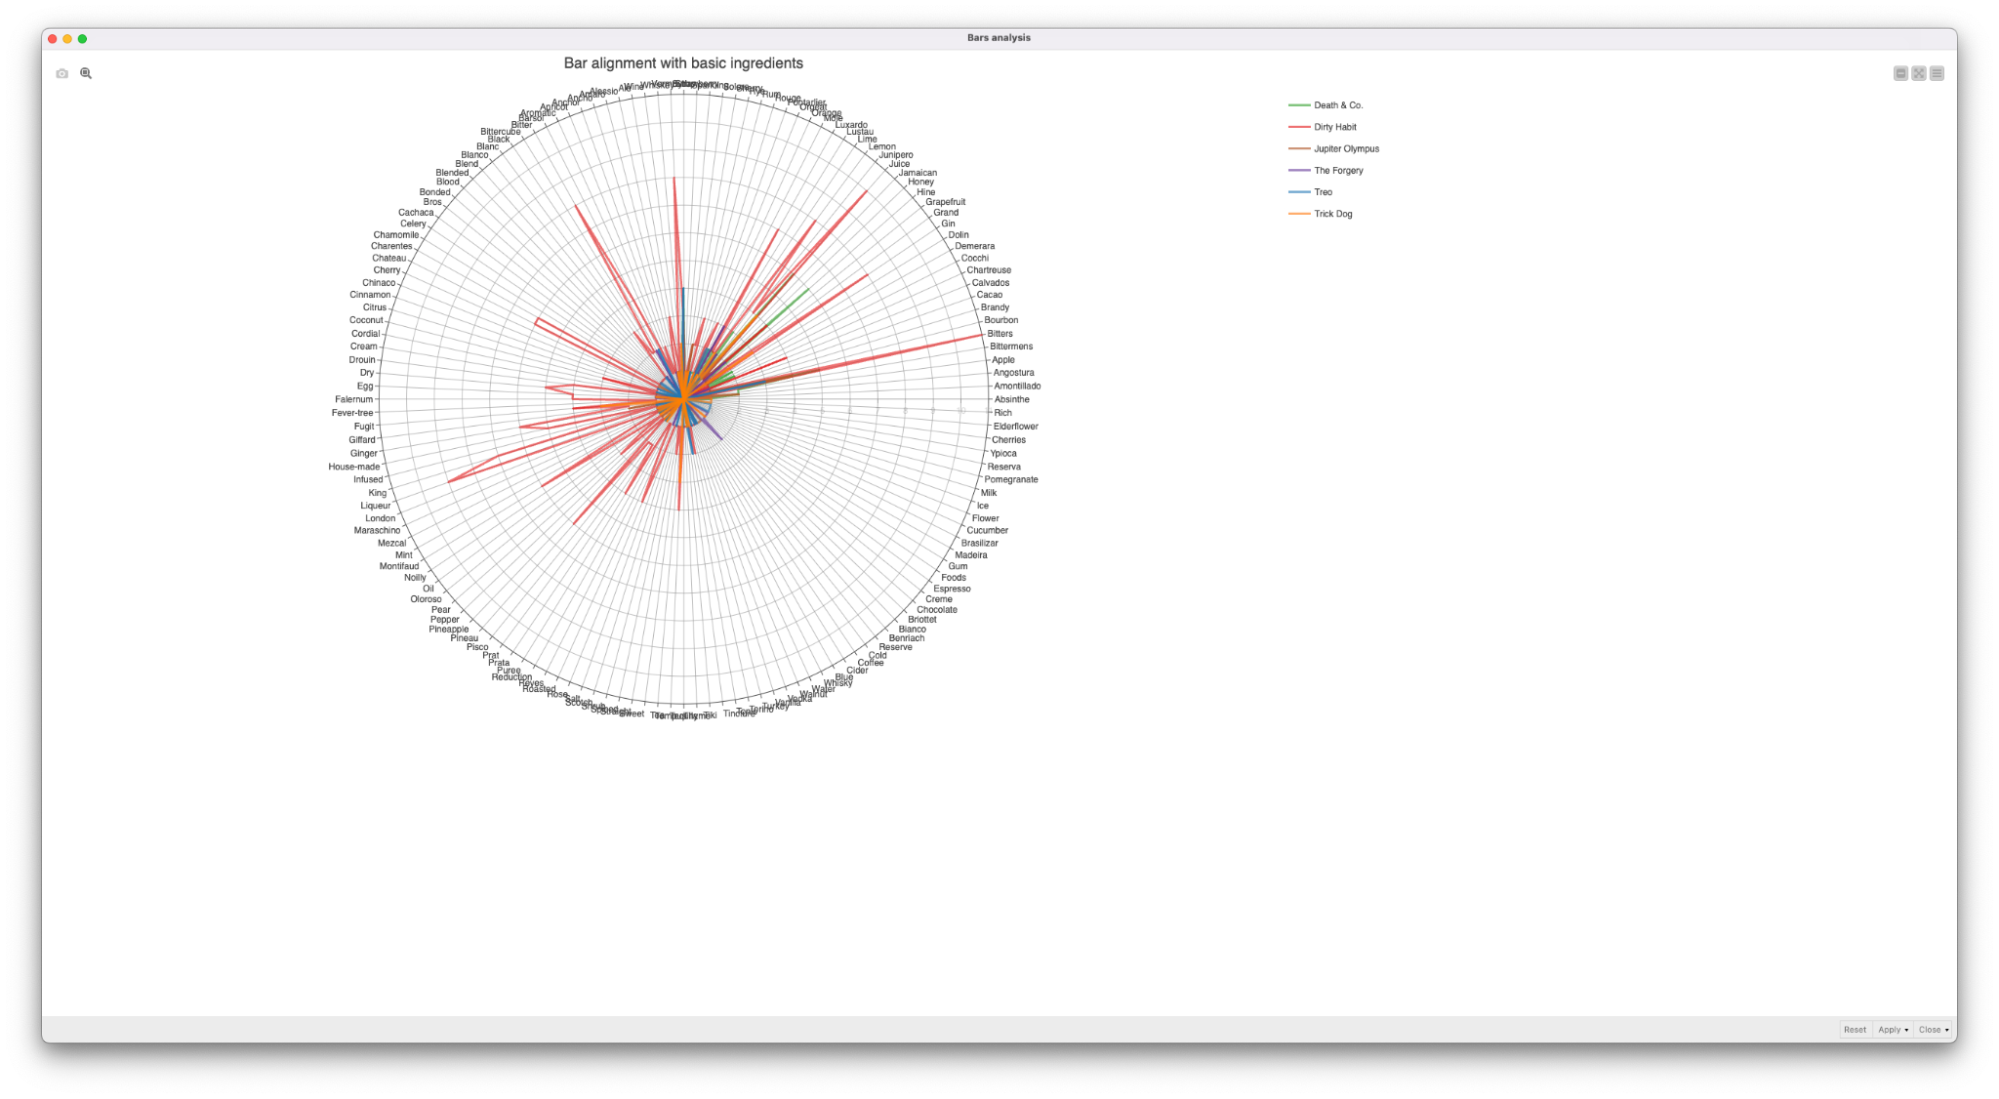
Use case 2: Match bars with ingredients
To help bars optimize their menus, we analyzed ingredient availability at different bars.
We looked at the bars with more than 29 ingredients and visualized them as a radar plot. The radar chart highlighted gaps in ingredient usage. (In the bottom right of the chart you can see that the ingredients are not used much by these 5 bars. This kind of information could help businesses discover opportunities for unique cocktail offerings.
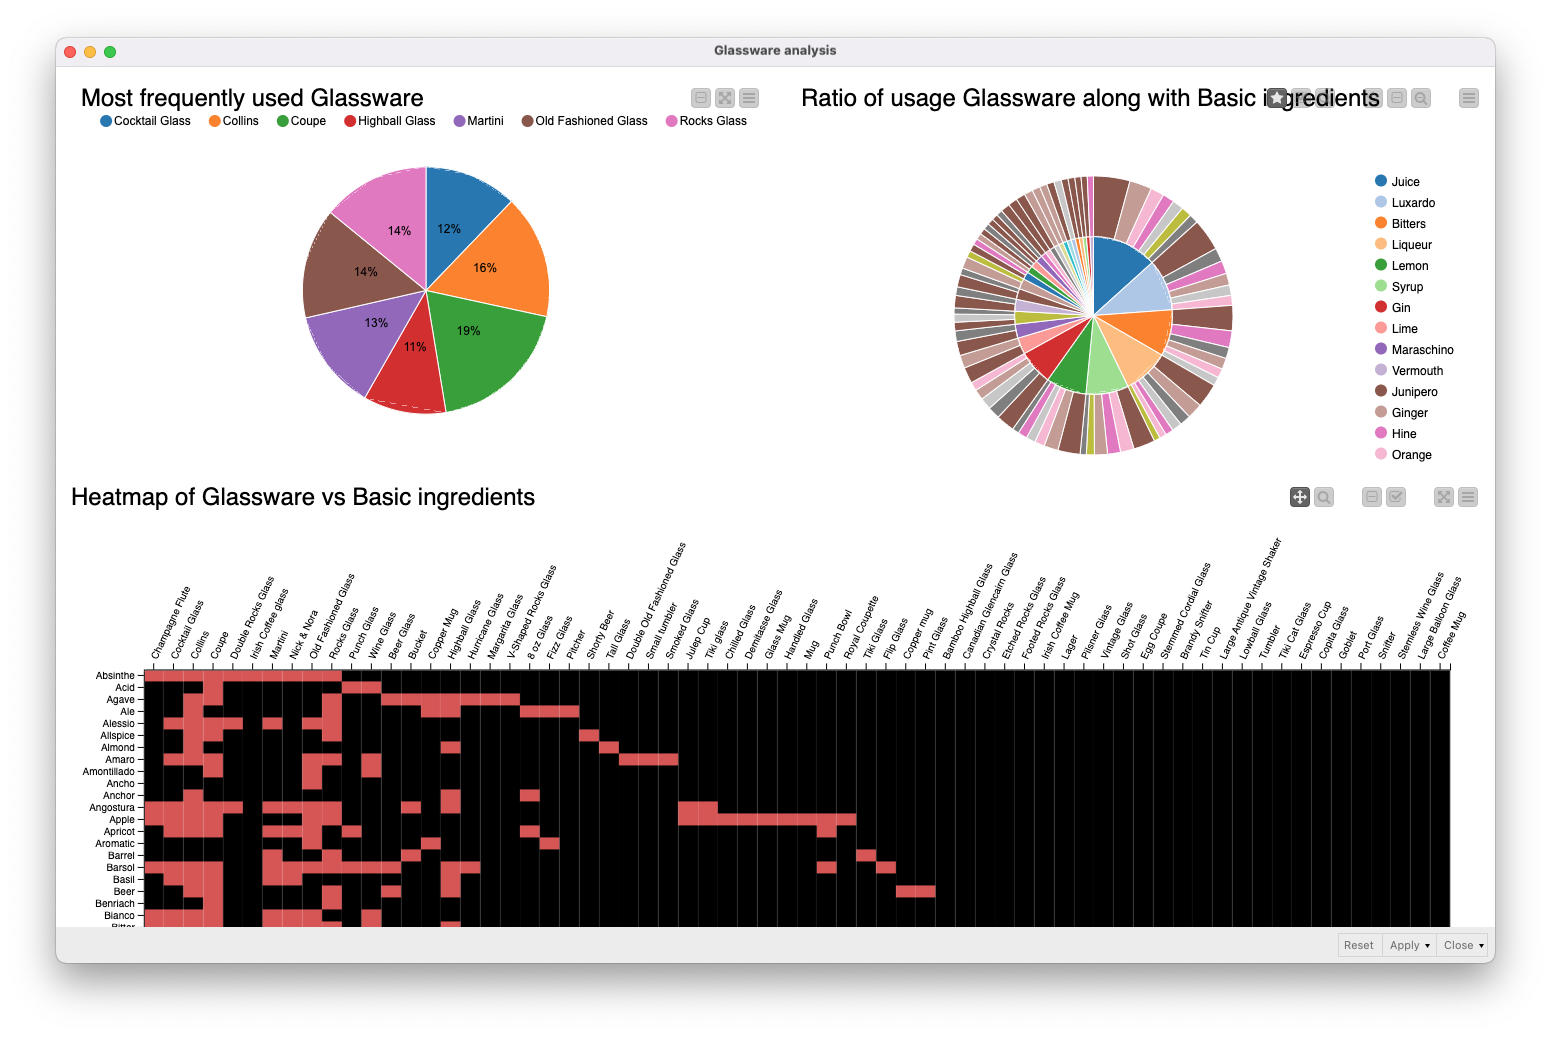
Use case 3: Understand glassware patterns
We explored the data to see if there are interesting connection patterns between cocktails that include basic ingredients and glassware.
- A pie chart shows how frequently glassware is used
- Our sunburst diagram visualizes the ratio of usage of basic ingredients per glassware.
- A heatmap visualization shows which glassware is either used or not used at all with certain ingredients.
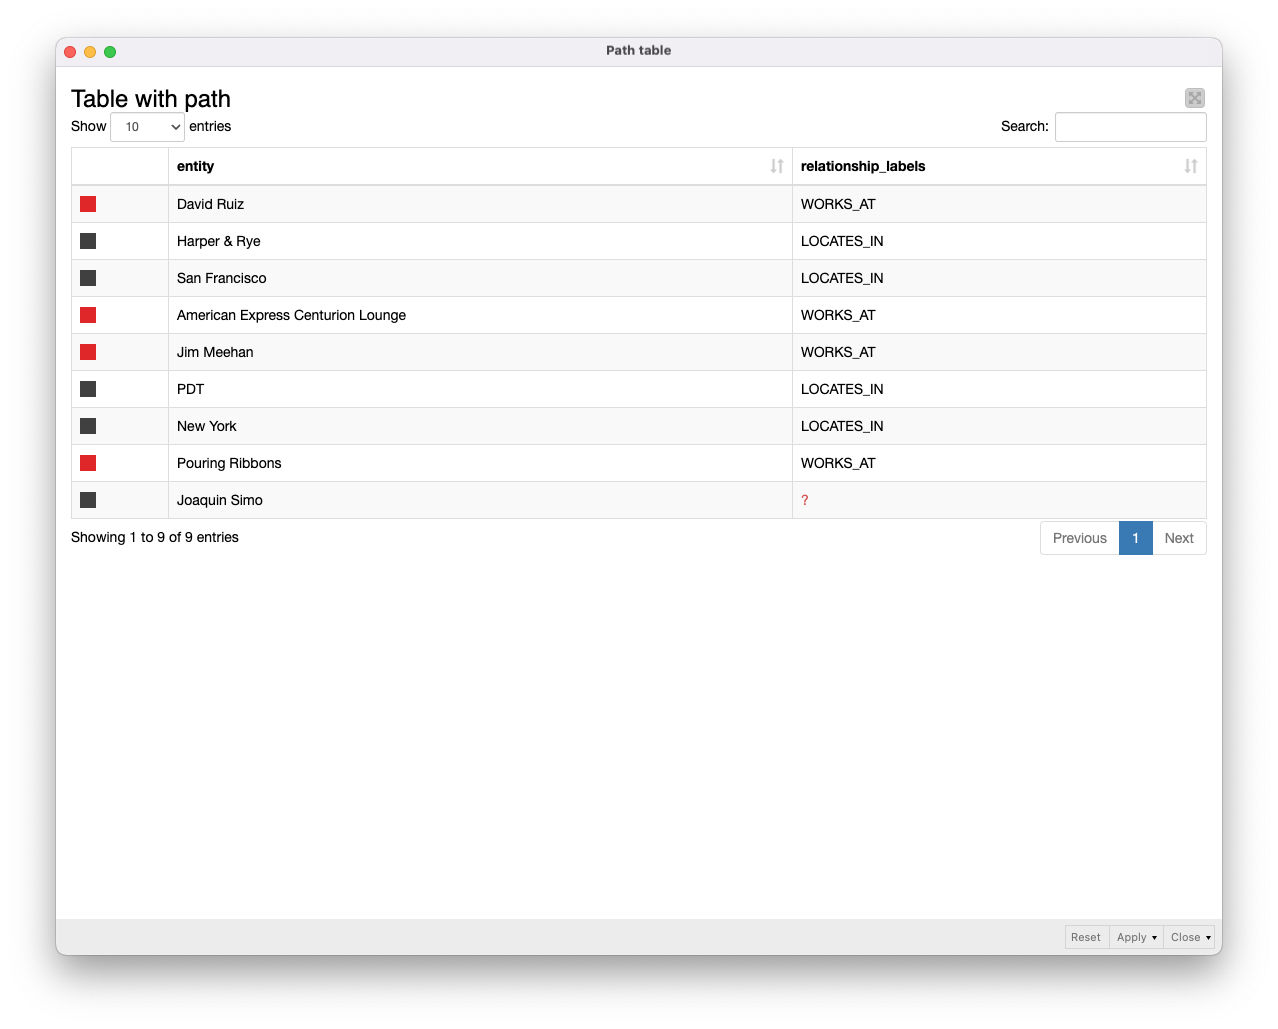
Use case 4: Find connections between bartenders
In this graph-specific use case we used graph traversal and pathfinding to examine connections between bartenders based on the bars they work at. This analysis revealed shared colleagues and potential networking opportunities.
We looked specifically at two bartenders — Joaquin Simo and David Ruiz – and lookedfor other bartenders they might know or the bars they might be working at.
- We wrapped all the step nodes and relationships into two lists, and then we unwind these lists with Ungroup node.
- Our visualization, built with the Path Table component, shows us that these two bartenders have a mutual colleague who works in two bars in New York and San Francisco.
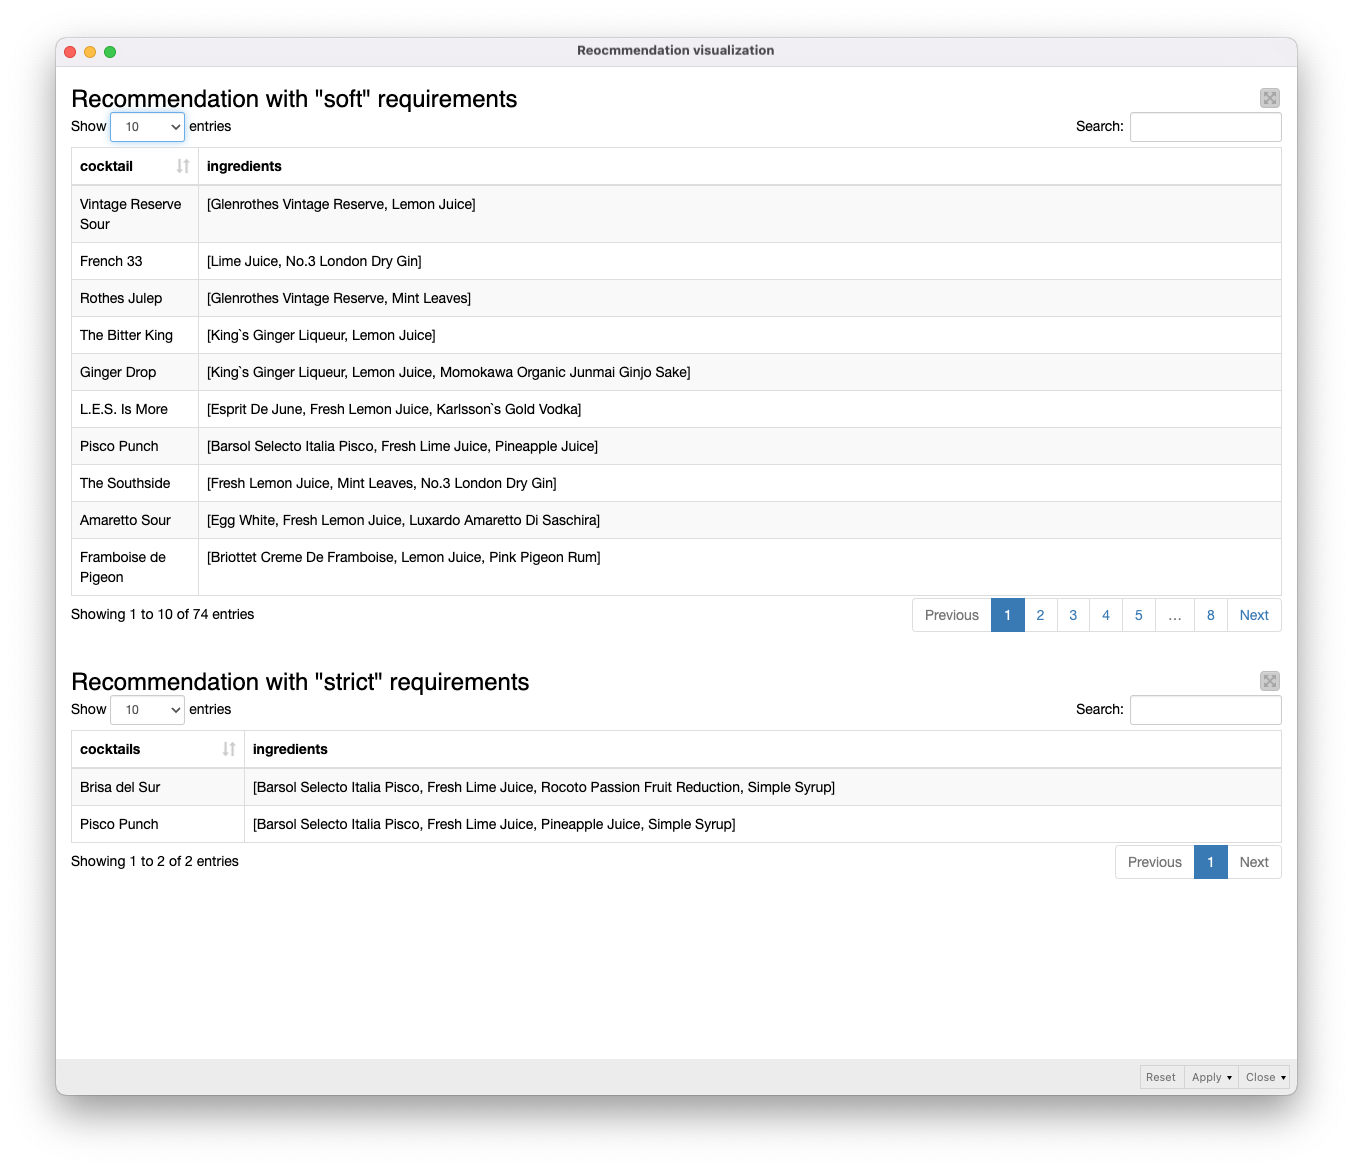
Use case 5: Recommend missing ingredients
By querying the database for missing ingredients in cocktail recipes, we can generate ingredient recommendations that could help bars optimize their inventory.
- Our query searches for what’s missing in our stock of ingredients to make some cocktails.
- The output is a table that contains cocktails and missing ingredients as recommendations (“soft” requirements).
- We can also be more specific by using “strict” requirements if we want our cocktails to be made using all the ingredients we have.
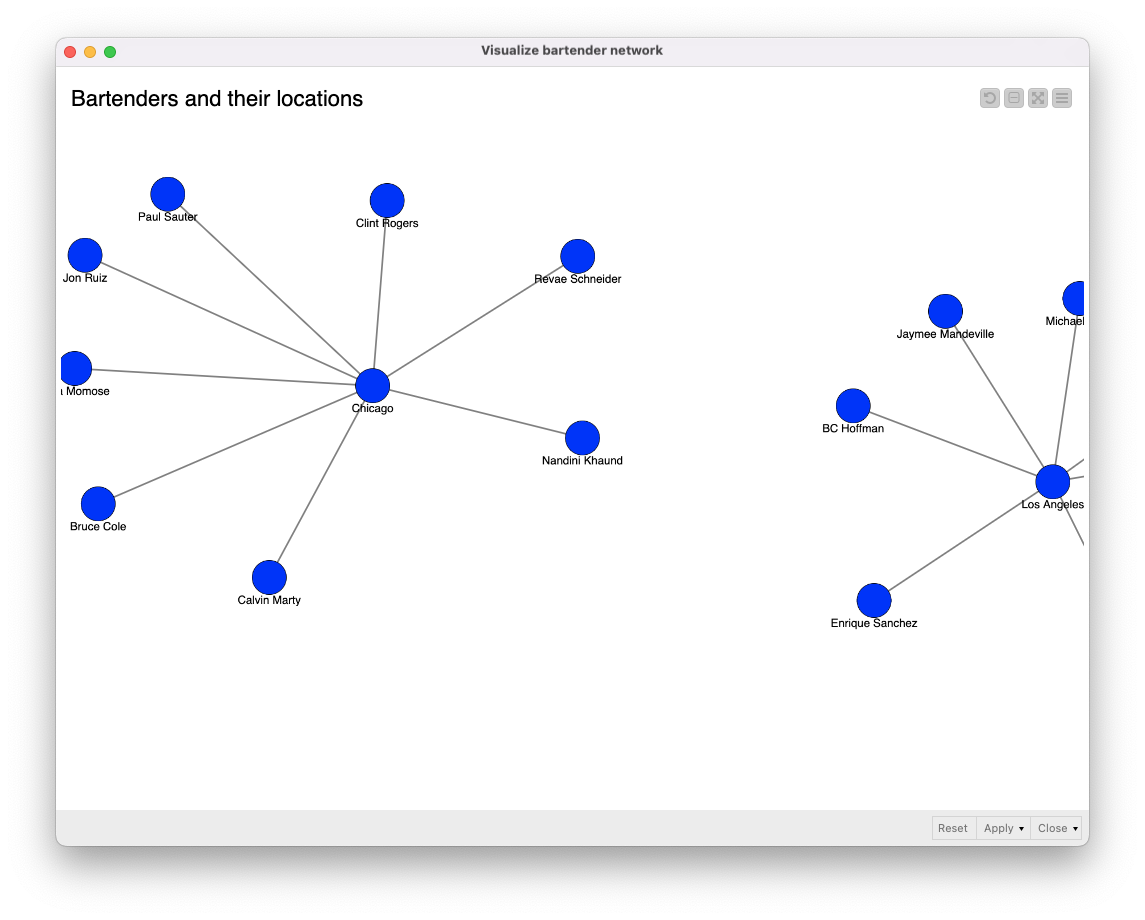
Use case 6: Map bartender locations
We visualized the locations of bartenders working in multiple bars with our bartender network component. This insight could be used to reveal more networking opportunities.
- First we look for the bartenders who work in more than one bar
- Second, we generate queries with the String Manipulation node to get the locations of the bars.
In the workflow, you can see that it is possible to run multiple reading queries at the same time, and the results will be returned as JSON files. This helps us to run different types of queries that might return distinct results. The JSON files are easily parsed with the JSON Path node –this is what we are doing inside the Visualize bartender network component, which shows the bartenders and their locations.
Download this workflow and try it out yourself
The workflow we used in this blog article is available for you to download and try out for yourself from the KNIME Hub.
Download the Cocktails graph with Memgraph workflow by Redfield from KNIME Community Hub here.
Why use the Memgraph Extension in KNIME?
- Seamless low-code integration: The Memgraph extension for KNIME brings graph database capabilities into a visual workflow environment, eliminating the need for complex coding
- Efficient graph processing joins forces with powerful data and AI capabilities: Memgraph offers a suite of tools for efficient graph data processing, including built-in graph algorithms, support for advanced graph analytics, integration with popular visualization tools, and compatibility with machine learning frameworks.
Download KNIME and Redfield's KNIME Memgraph Extension to combine graph data processing with KNIME's powerful data & AI capabilities.
Redfield is a KNIME Trusted Partner.